

Sales analysis – more than just tracking sales revenue
Sales revenue is one of the key indicators used to assess a company’s performance, but tracking revenue alone does not provide the full picture. When analyzing sales, it is important to look not only at revenue, but also at sales volume, average selling price, margin, profit, and changes in these metrics over time.
Growing sales revenue does not necessarily mean that a company’s performance is improving. Cost of goods sold or operating expenses may increase faster than revenue, meaning that even as sales grow, the company’s profit may decline or even turn into a loss.
For this reason, sales analysis should not be limited to the question of how much the company sold during a given period. It is important to understand what drove changes in sales, where performance is improving or declining, and whether profitability can be maintained as sales grow.
Continuous sales analysis is valuable not only when overall performance begins to deteriorate. It can help identify changing trends, problem areas, and potential growth opportunities at an earlier stage – insights that may not be immediately visible in overall sales results.
This type of business analytics is relevant not only to company’s CEO or CFO. Sales managers, account managers, commercial teams, and marketing teams can use the same data to address different business questions.
Sales analysis should show not only the results, but also what drives them
Sales analysis can start with key metrics such as sales revenue and its trends over time. However, the overall result does not answer the most important question: what drove it. Understanding the reasons behind these changes provides a clearer view of the situation and enables better, data-driven business decisions.
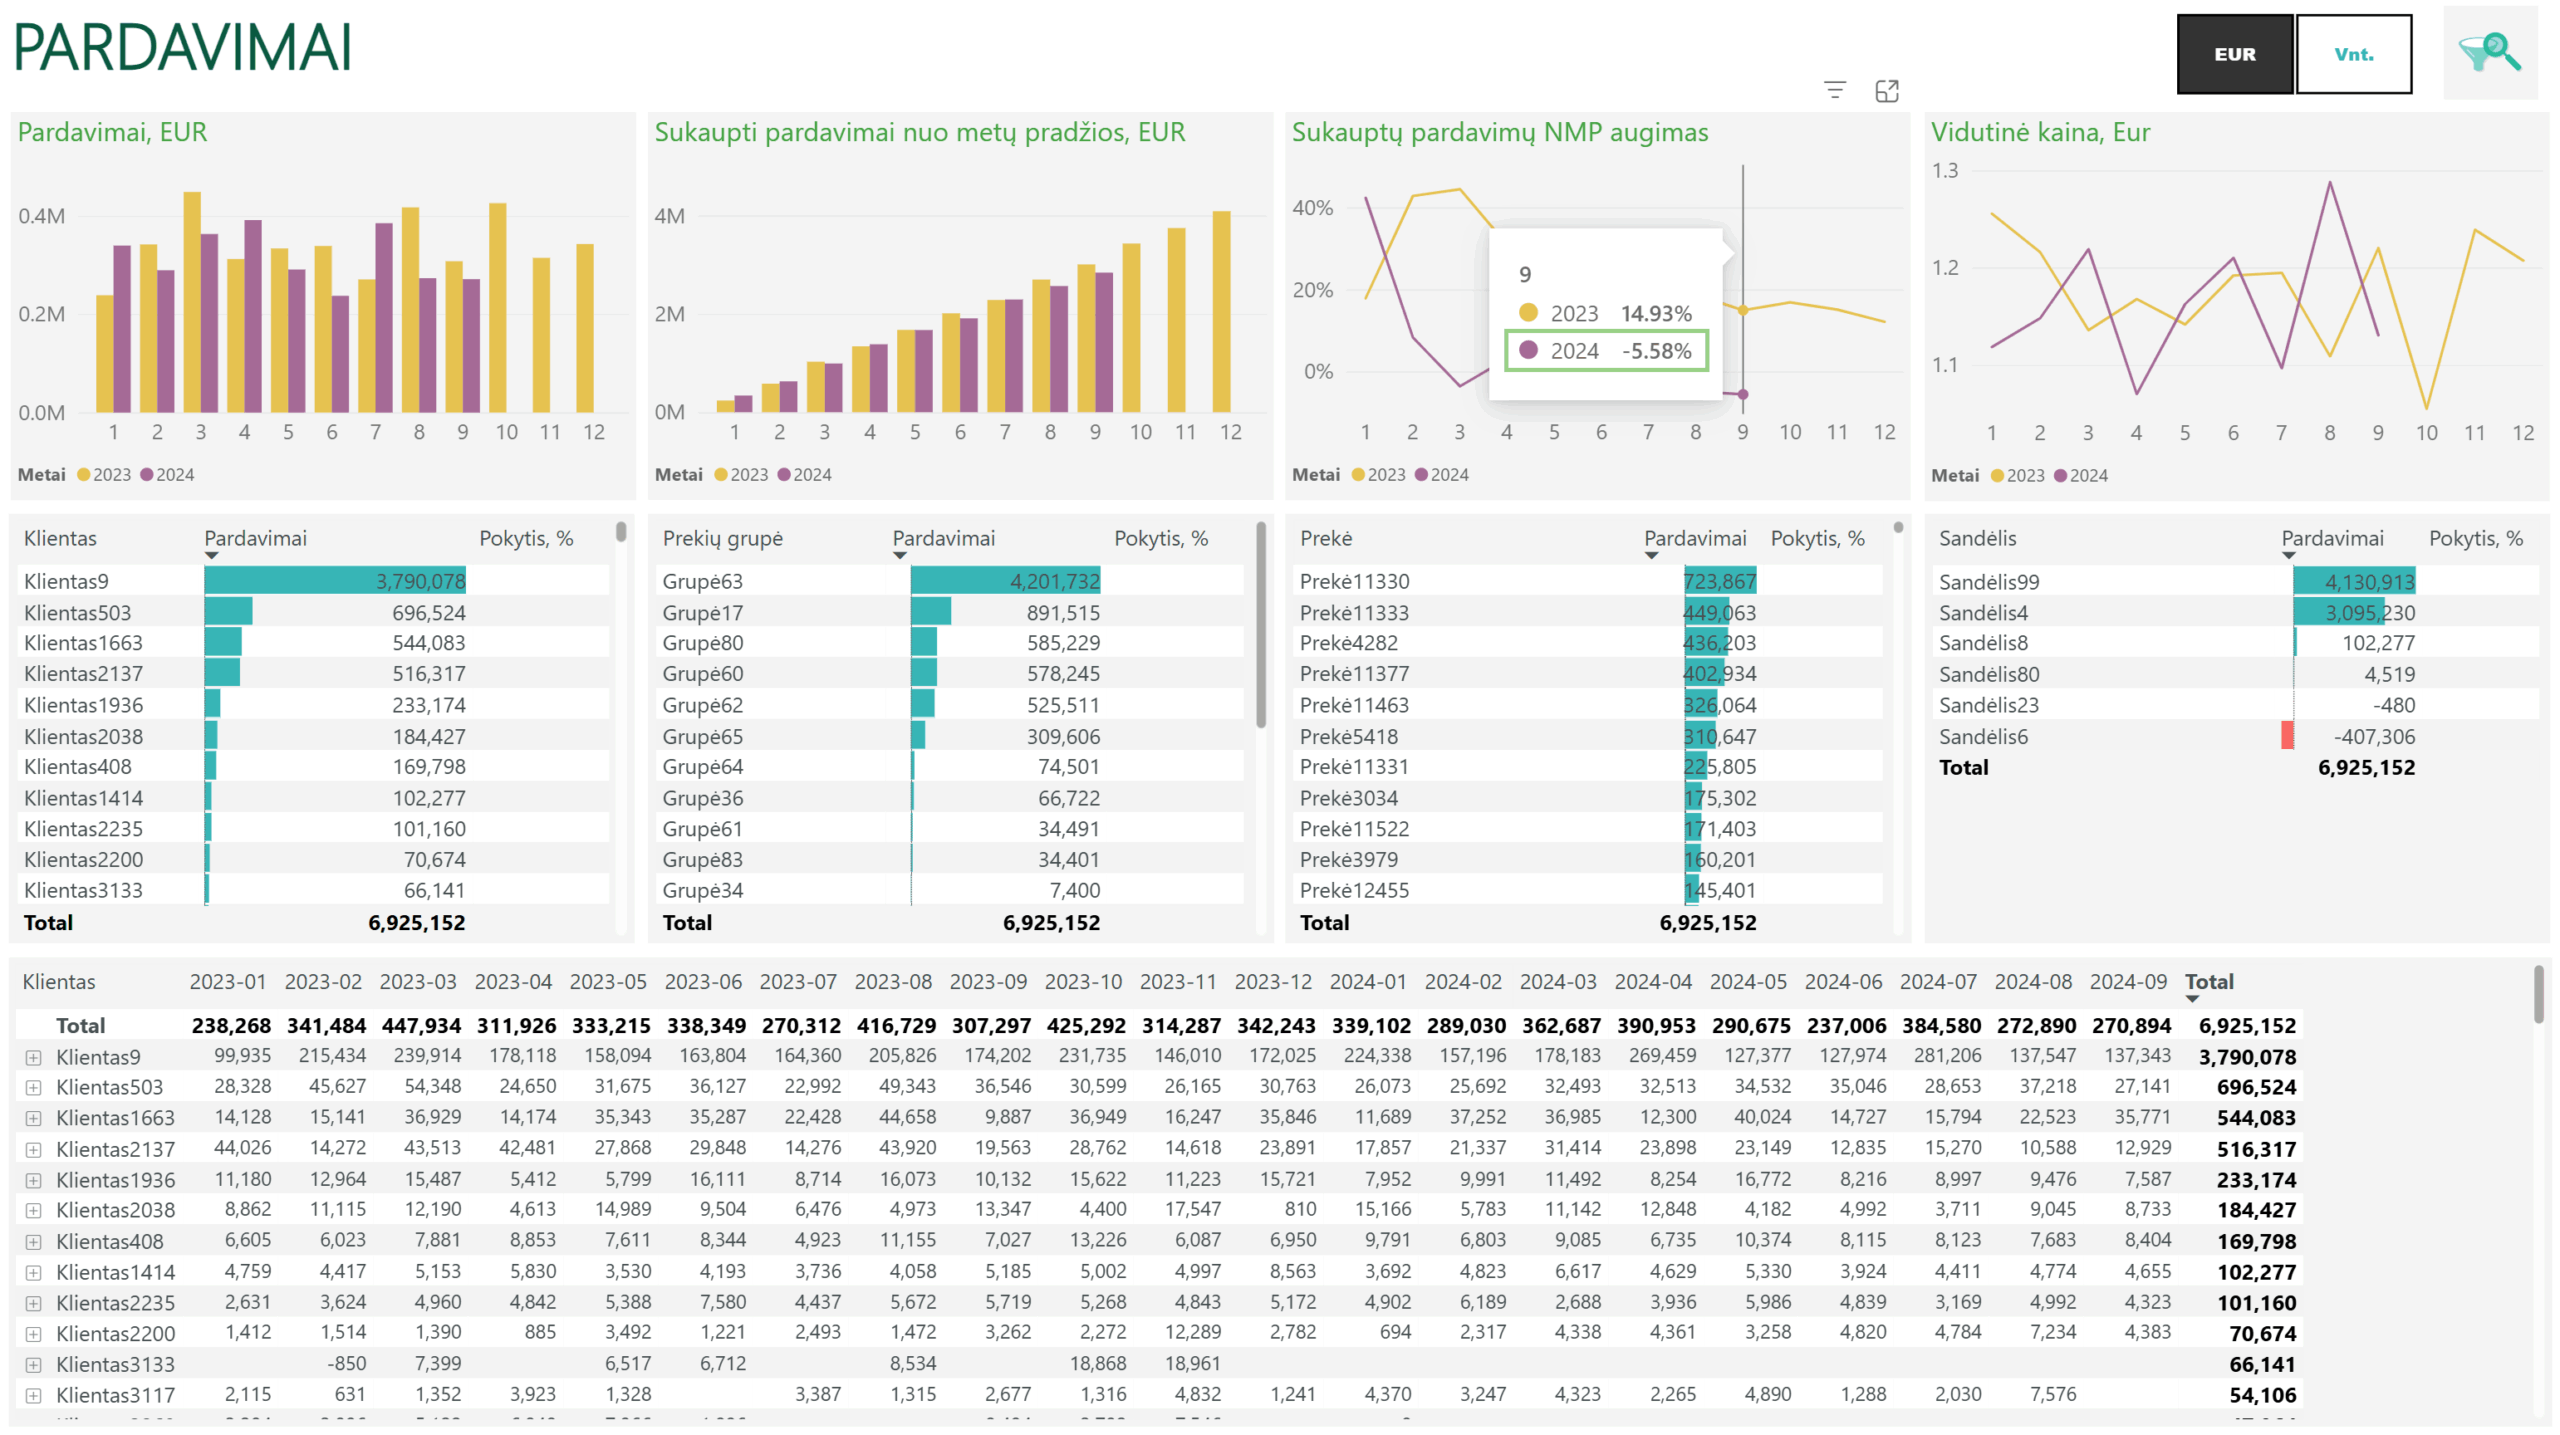
Sales analysis by customers, products, and other business segments
To understand what drives changes in sales, it is important to analyze the results in greater detail. A good starting point is to identify which sales channels, customers, products, product groups, or other business segments had the greatest impact on overall sales growth or decline. Interactive Power BI sales reports are particularly useful for this type of analysis, allowing users to move from the overall result to the underlying factors that drove it.
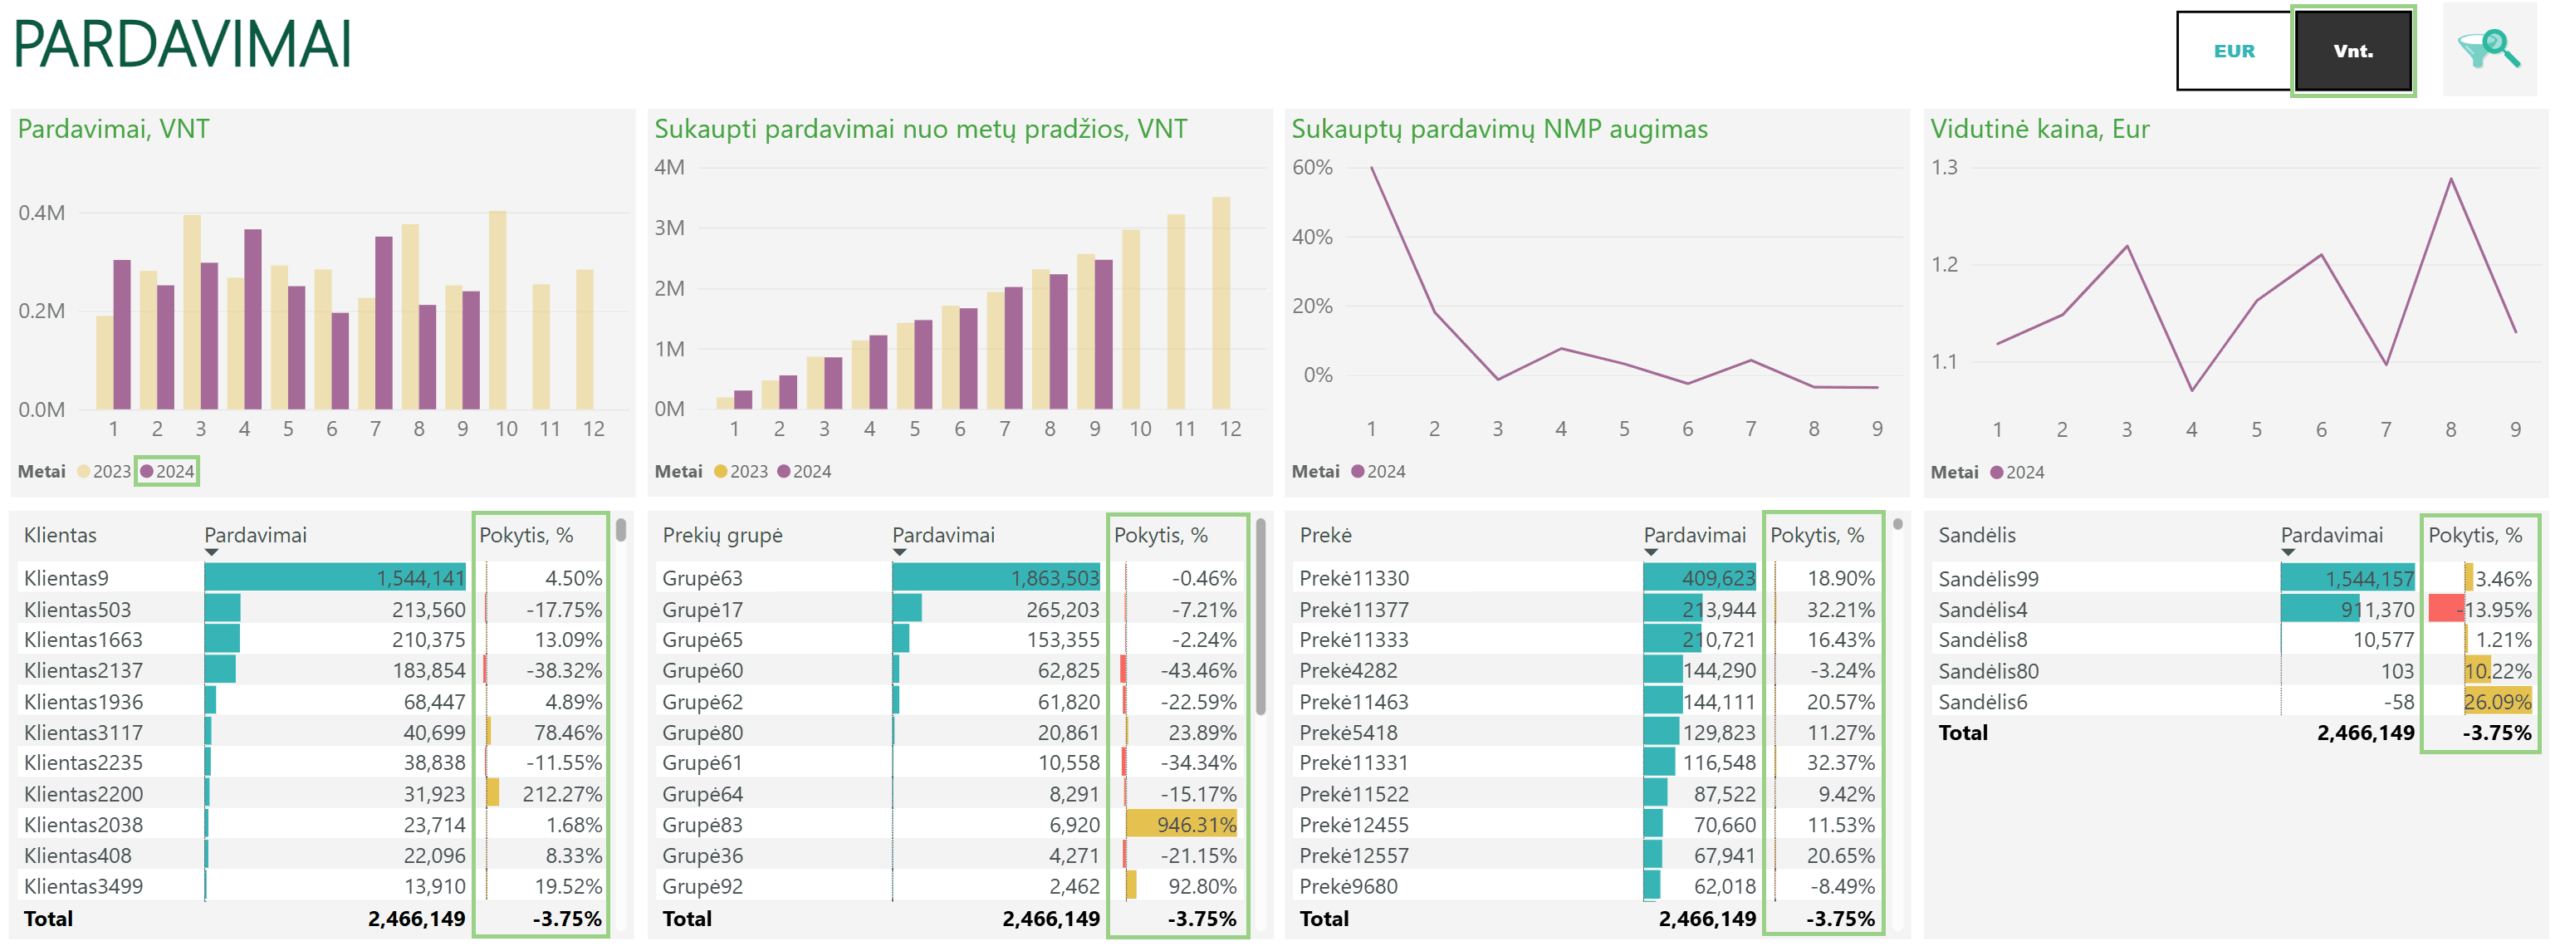
In PLY Business Power BI sales reports, you can quickly identify which business segments had the greatest impact on changes in sales revenue over a selected period. Once you select the year or month you want to analyze, the report automatically recalculates changes in sales revenue across the company’s relevant analytical dimensions. This makes it easy to see which customers, product groups, products, or other business segments contributed most to sales growth or decline.
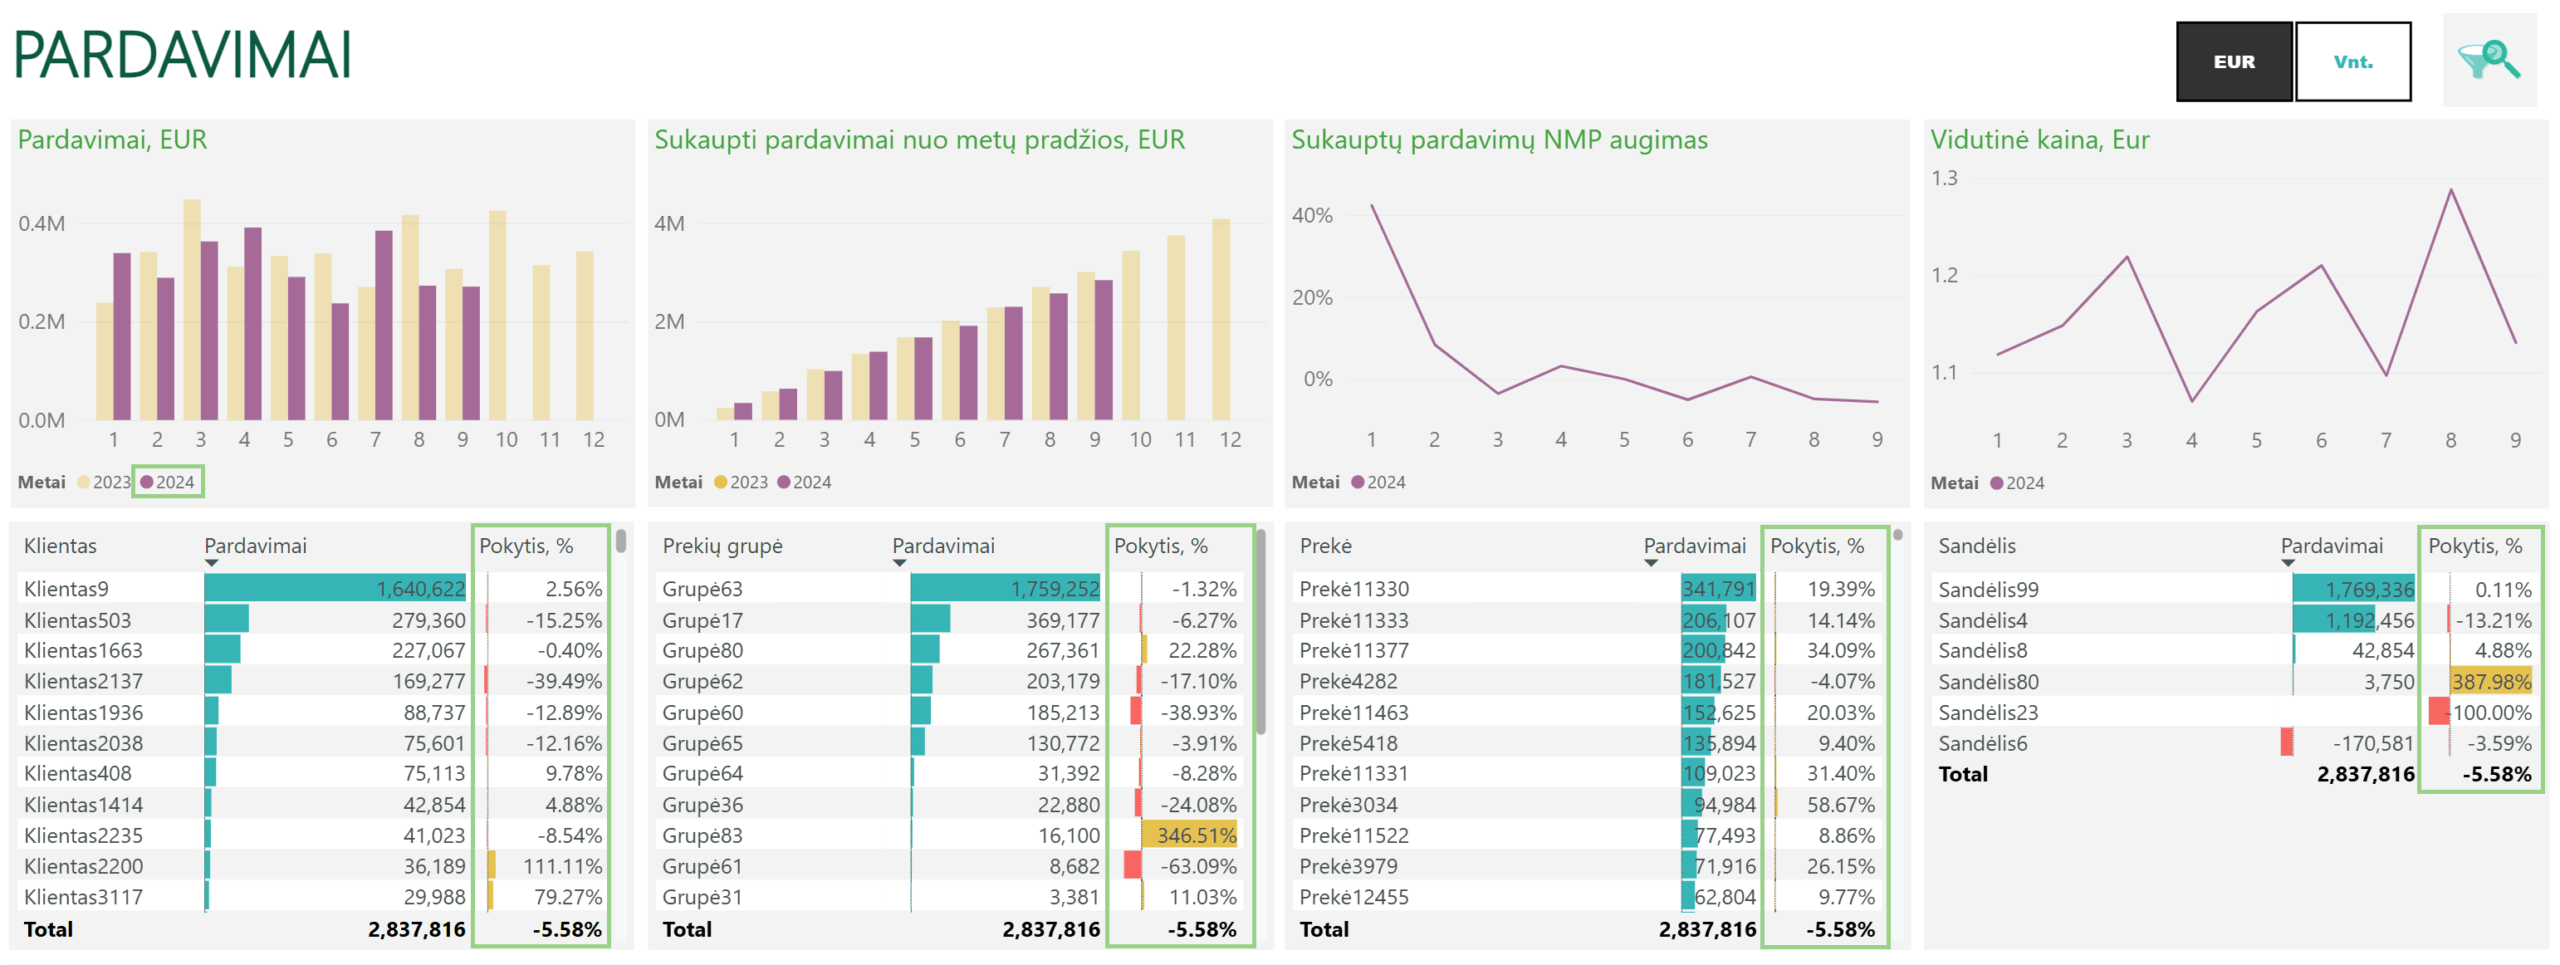
However, the analysis should not stop at this stage. Once you have identified customers whose sales declined during the selected period, you can analyze their performance in greater detail and look for the specific factors behind these changes.
In the PLY Business Power BI sales report demo, selecting a customer automatically updates the rest of the report data based on that selection. This allows you to see which products or product groups the customer purchased less of and which they purchased more of, helping you identify the factors that had the greatest impact on the change in sales.
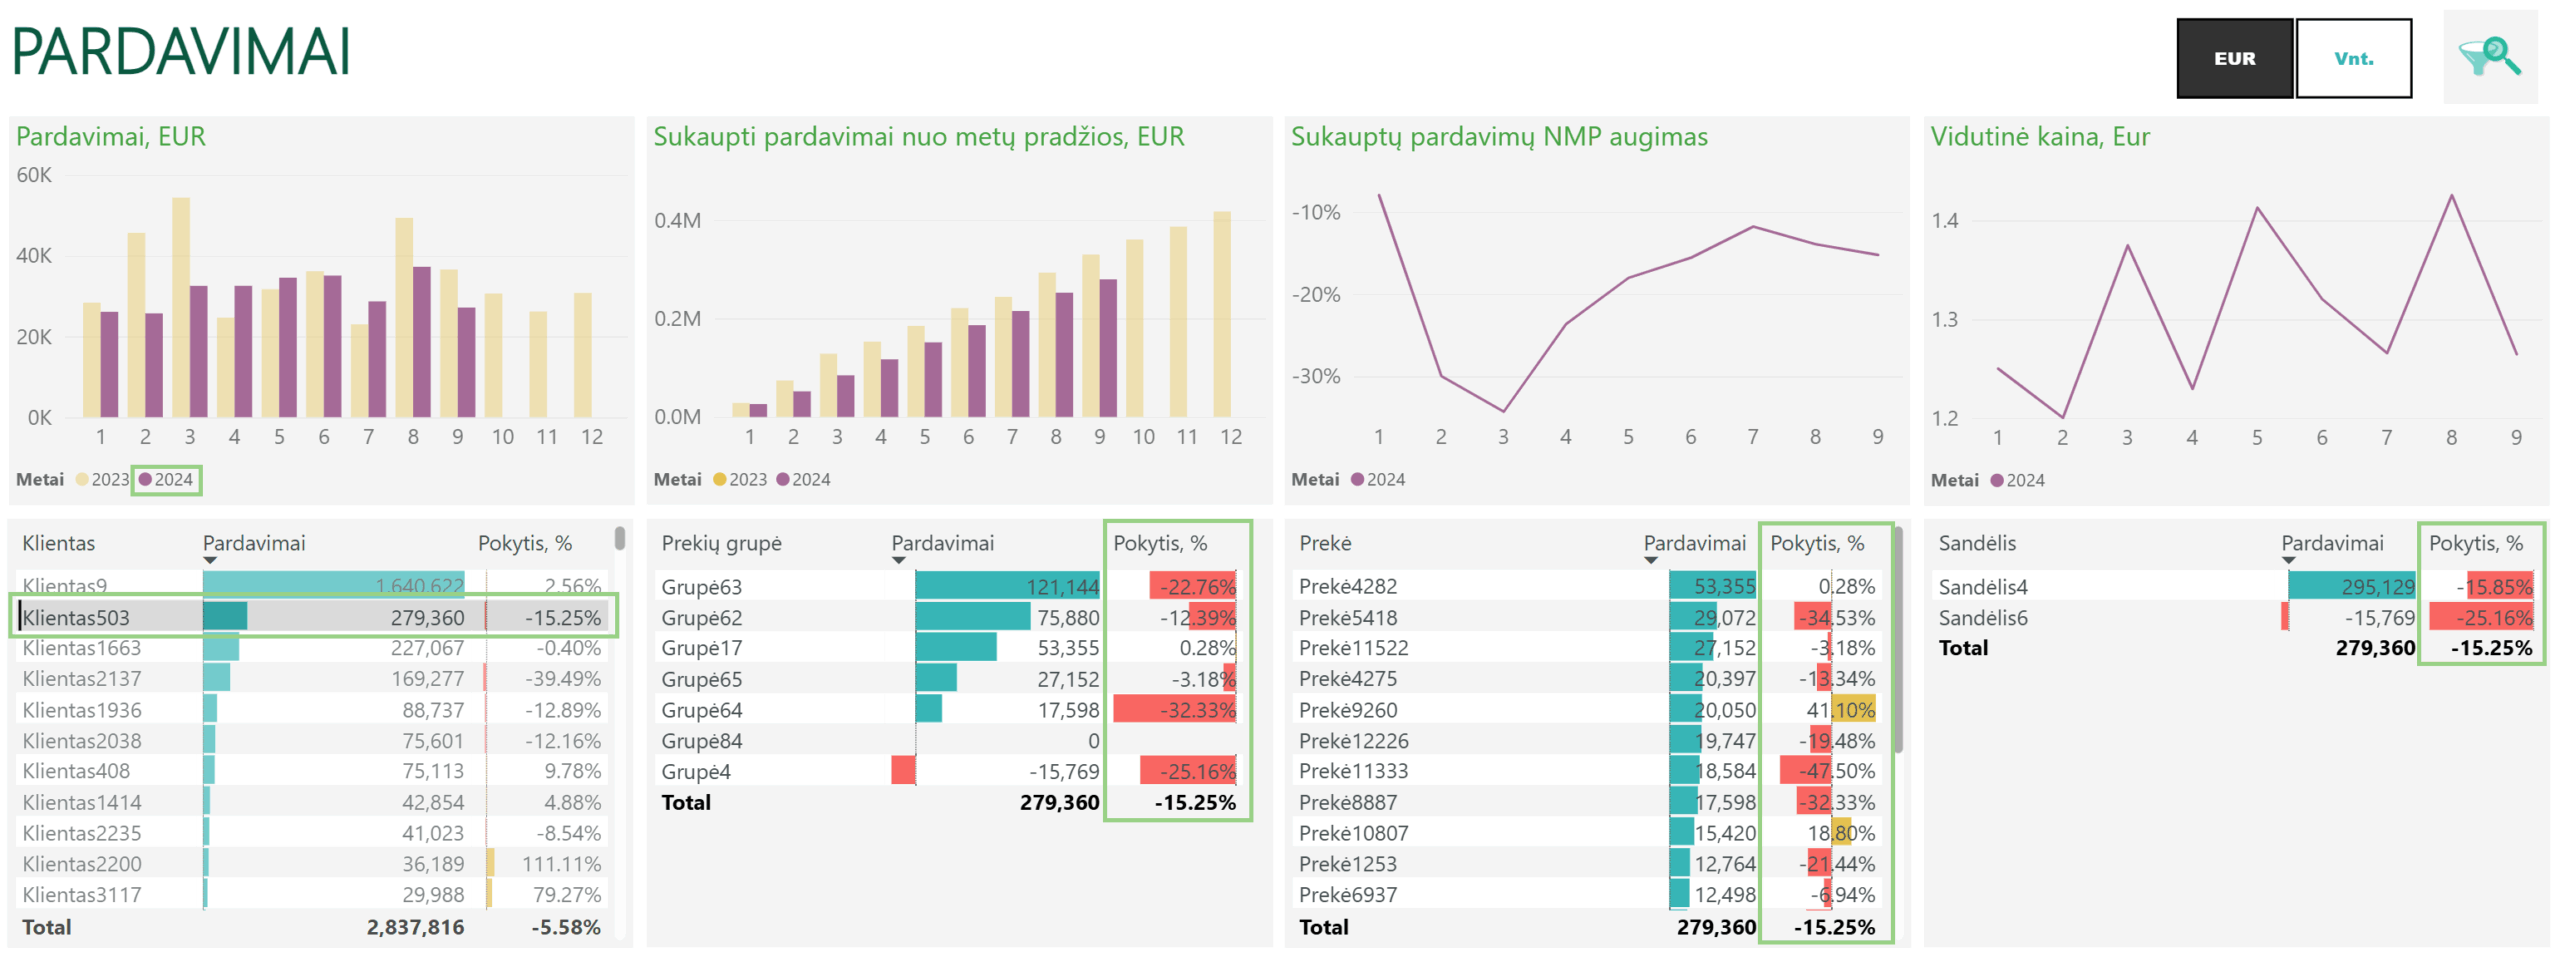
This is where analysis turns into concrete action – a sales manager can not only see that a customer’s sales have declined but also know where to start the conversation. By understanding which products the customer has started purchasing less of, the sales manager can explore the reasons behind the decline, discuss the customer’s needs, and look for opportunities to recover lost sales or grow existing ones.
The analysis can also be approached from the opposite direction. If a significant change in sales of a particular product or product group is identified, that segment can be selected to analyze which customers’ purchasing activity contributed most to the increase or decline in sales.
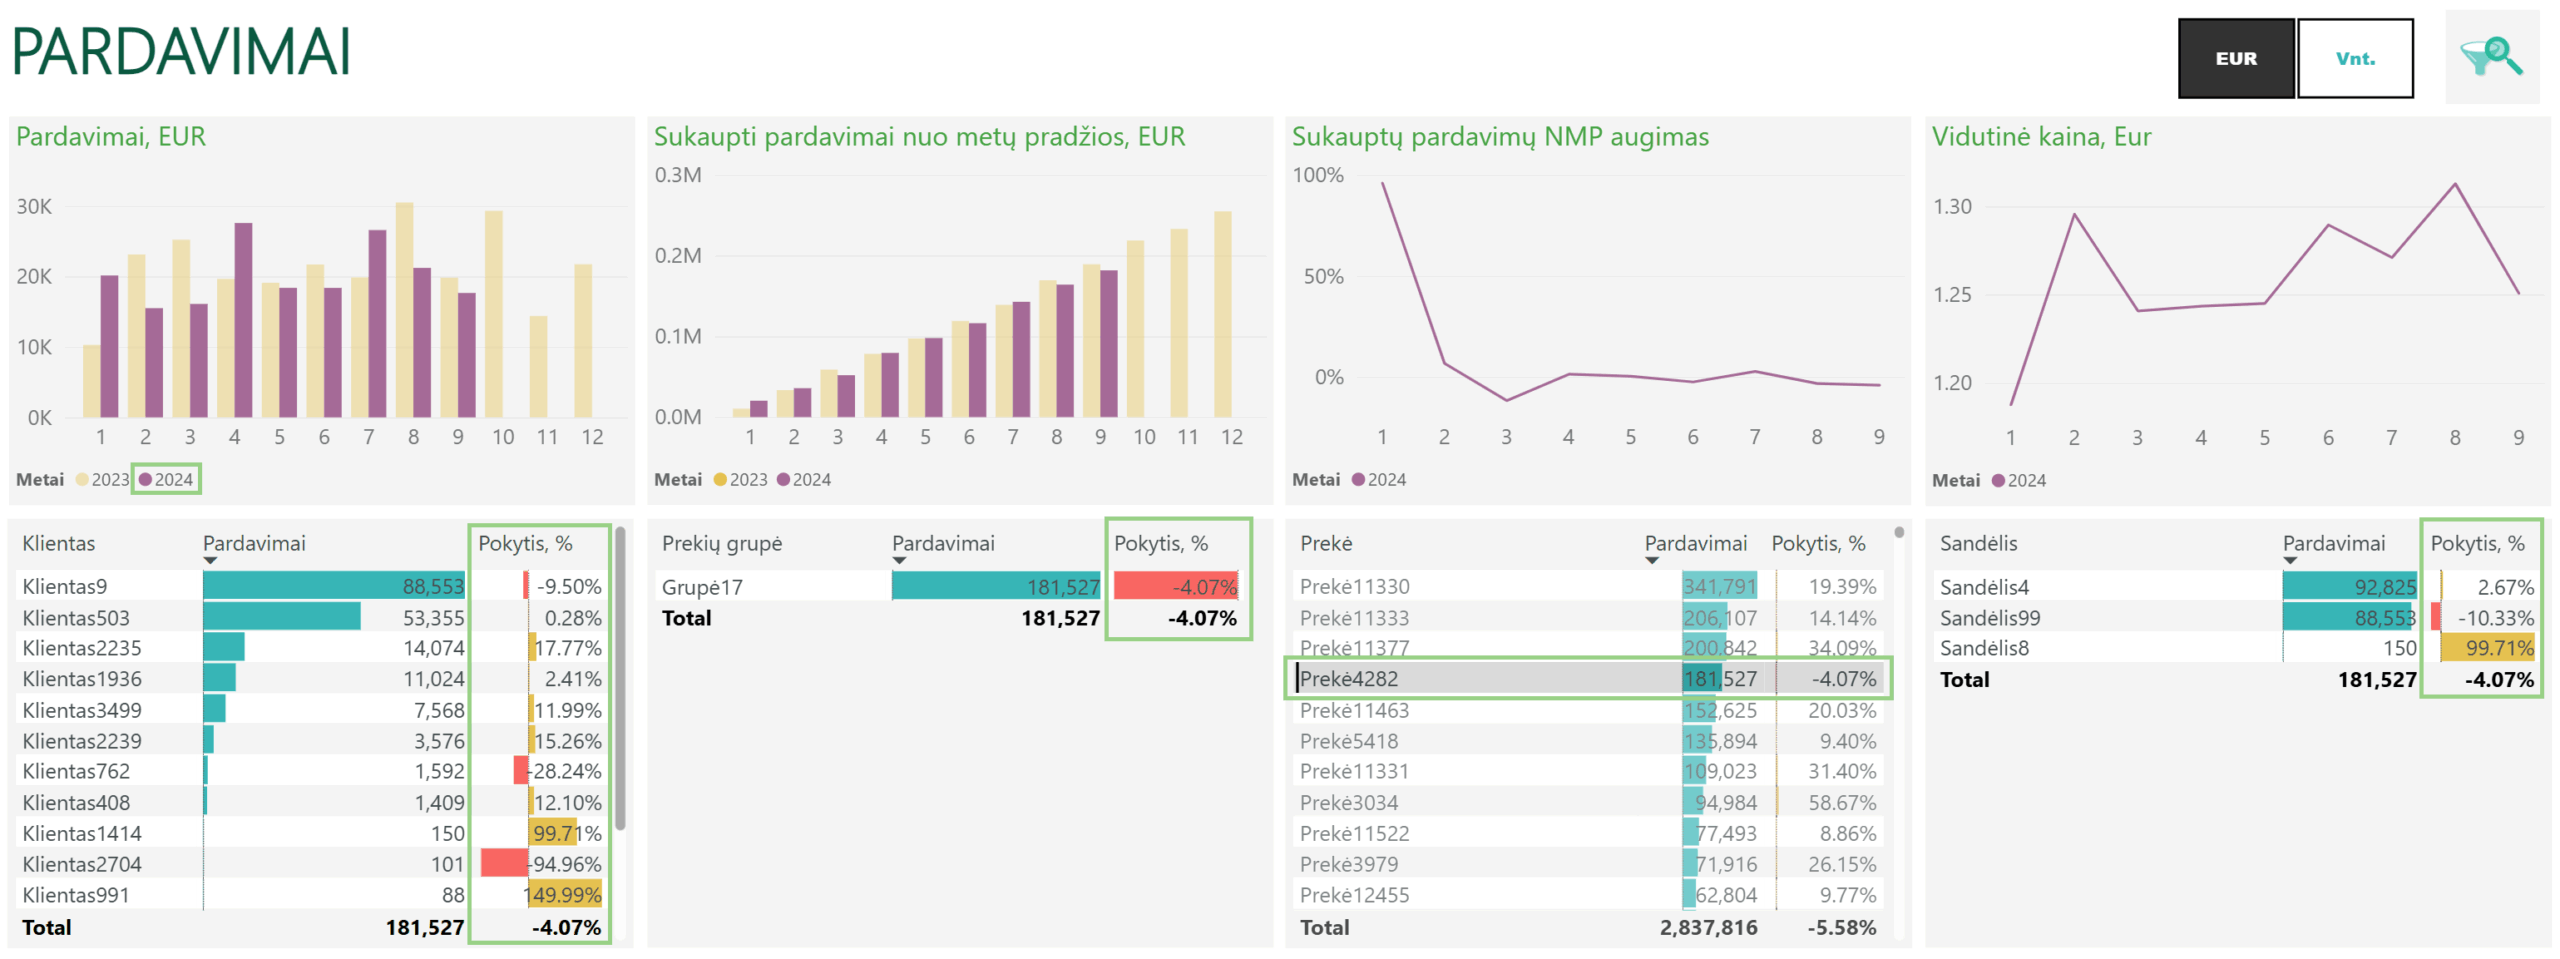
Each company has a different business model, data structure, and analysis needs, which means that the analytical dimensions relevant to each company also vary. For this reason, when developing Power BI reports, we tailor the analytical dimensions to each company’s specific needs. For one company, the main focus may be sales analysis by customers and products, while for another, it may be analysis by sales managers, business units, projects, or other dimensions relevant to its operations.
Analysis of sales revenue, sales volume, and price
If a company sells physical goods, analyzing sales revenue in euros alone is not enough. Changes in revenue can be driven not only by an increase or decrease in the quantity of goods sold, but also by changes in selling prices. For example, growing revenue does not necessarily mean that the company sold more products – the increase may also be the result of higher prices.
Depending on the company’s business model and analysis needs, PLY Business Power BI reports can be designed to analyze sales both by value and by units sold, while also tracking changes in the average selling price. For example, in our sales report demo, users can switch the sales view from euros to units and analyze the same results by customers, products, product groups, or other relevant dimensions.
This type of analysis provides a clearer understanding of what is driving changes in sales revenue – changes in sales volume, selling prices, or a combination of both. This is important for assessing actual sales performance and determining where to look for growth opportunities or the causes of negative trends.
Different types of metrics may be relevant in retail, for example, where it is important to analyze not only sales revenue and the quantity of goods sold, but also customer purchasing behavior. Two such metrics are the number of transactions and average basket value.
If sales revenue increased while the number of transactions remained unchanged or even decreased, this may indicate that the average value per transaction increased. Conversely, revenue may grow due to a higher number of transactions, even if the average basket value remains relatively stable or declines. At first glance, both scenarios show sales growth, but the underlying drivers and potential business decisions are different.
For this reason, sales analytics should focus on the metrics that are most relevant to the specific business model.
Sales growth does not guarantee profit growth
Sales analysis is closely linked to a company’s financial and profitability analysis. Growing sales revenue does not necessarily mean that the company’s profit is growing as well.
Sales may increase, but rising cost of goods sold, lower selling prices, or higher discounts can lead to a decline in gross margin. In such cases, gross profit may grow significantly more slowly than sales, remain relatively stable, or even decline. Therefore, when analyzing sales performance, it is important to track not only revenue but also gross profit and gross margin.
In the PLY Business Power BI report demo, gross profit, just like sales revenue, can be analyzed across different analytical dimensions. You can see how much gross profit is generated by individual customers, products, product groups, or other business segments, as well as the gross margin achieved on those sales. You can also track how these results change across different years or individual months.
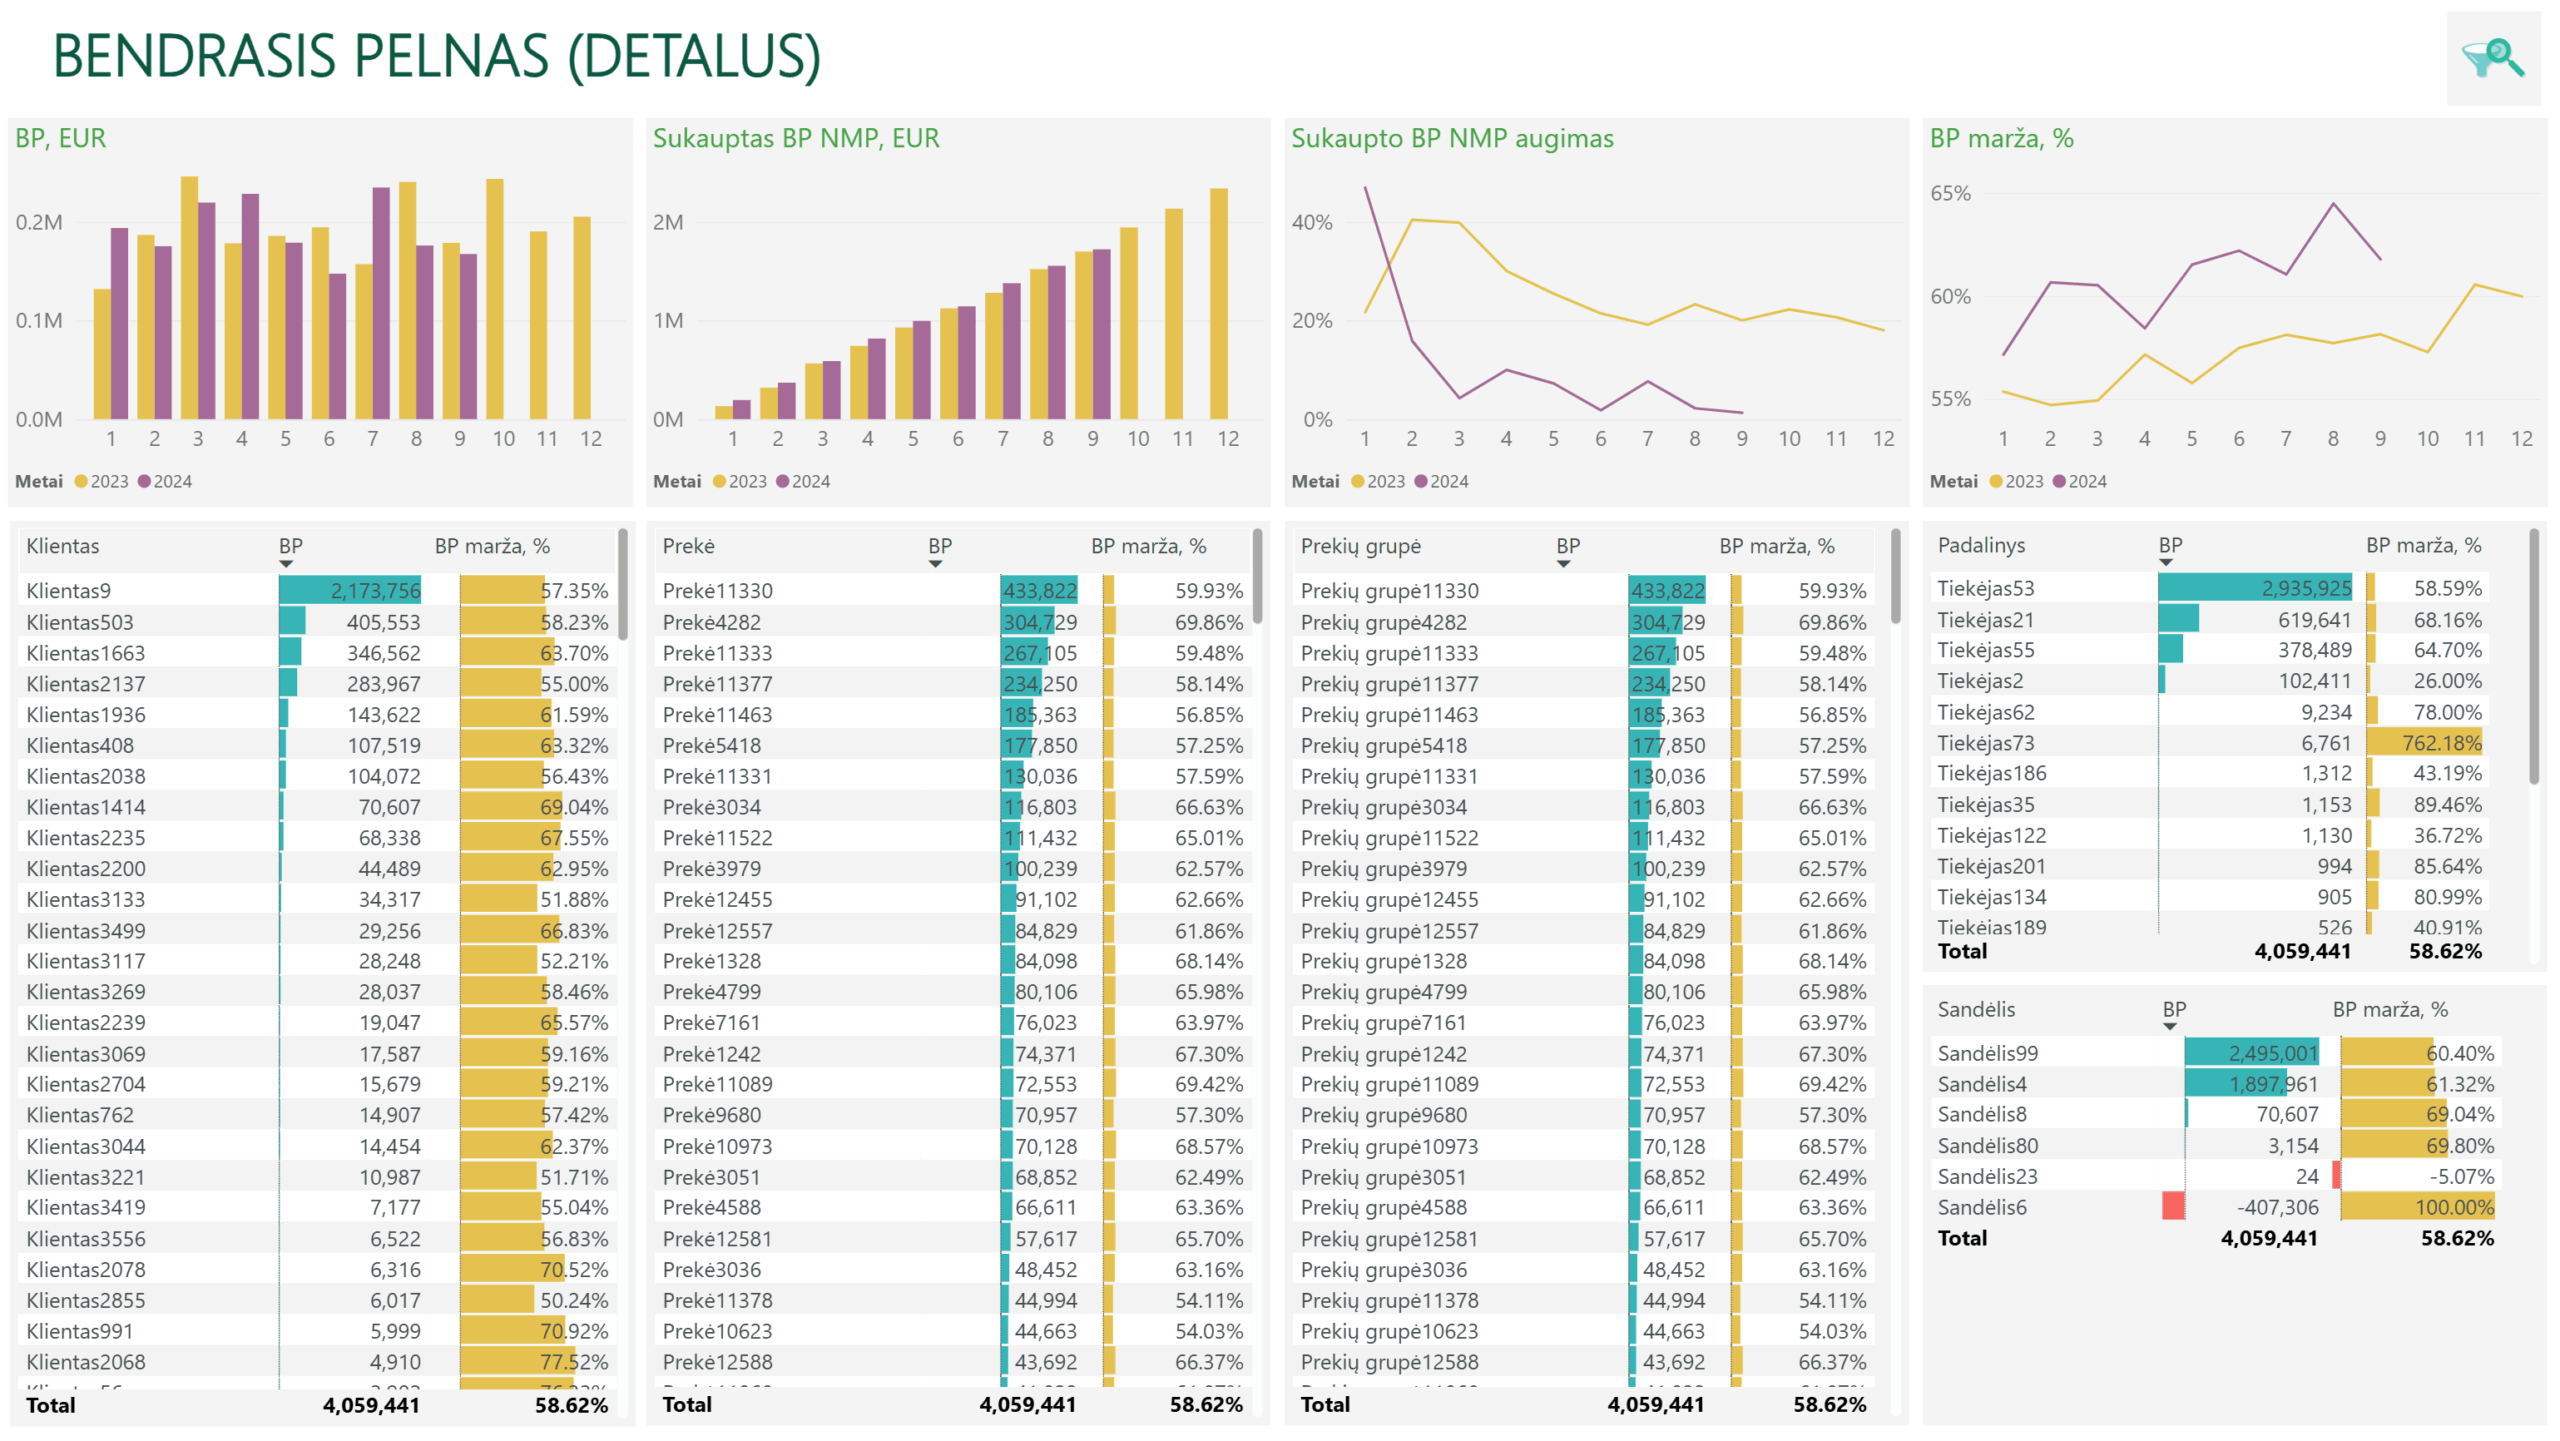
This type of analysis helps identify situations that would not be visible from sales revenue alone. For example, sales revenue from a particular customer may be growing, but if the customer receives higher discounts or the cost of goods sold increases, the margin generated from that customer may decline. Therefore, higher revenue does not necessarily translate into a proportional increase in gross profit.
Interactive Power BI analysis makes it possible to examine these results in greater detail. When a specific product is selected, the entire report automatically updates based on that selection, making it possible to see how much gross profit the product generated and the margin at which it was sold to different customers. For example, the analysis may reveal that the same product is sold to some customers at a significantly lower margin than to others. This can provide a basis for taking a closer look at pricing, discounts, or other factors behind differences in margins.
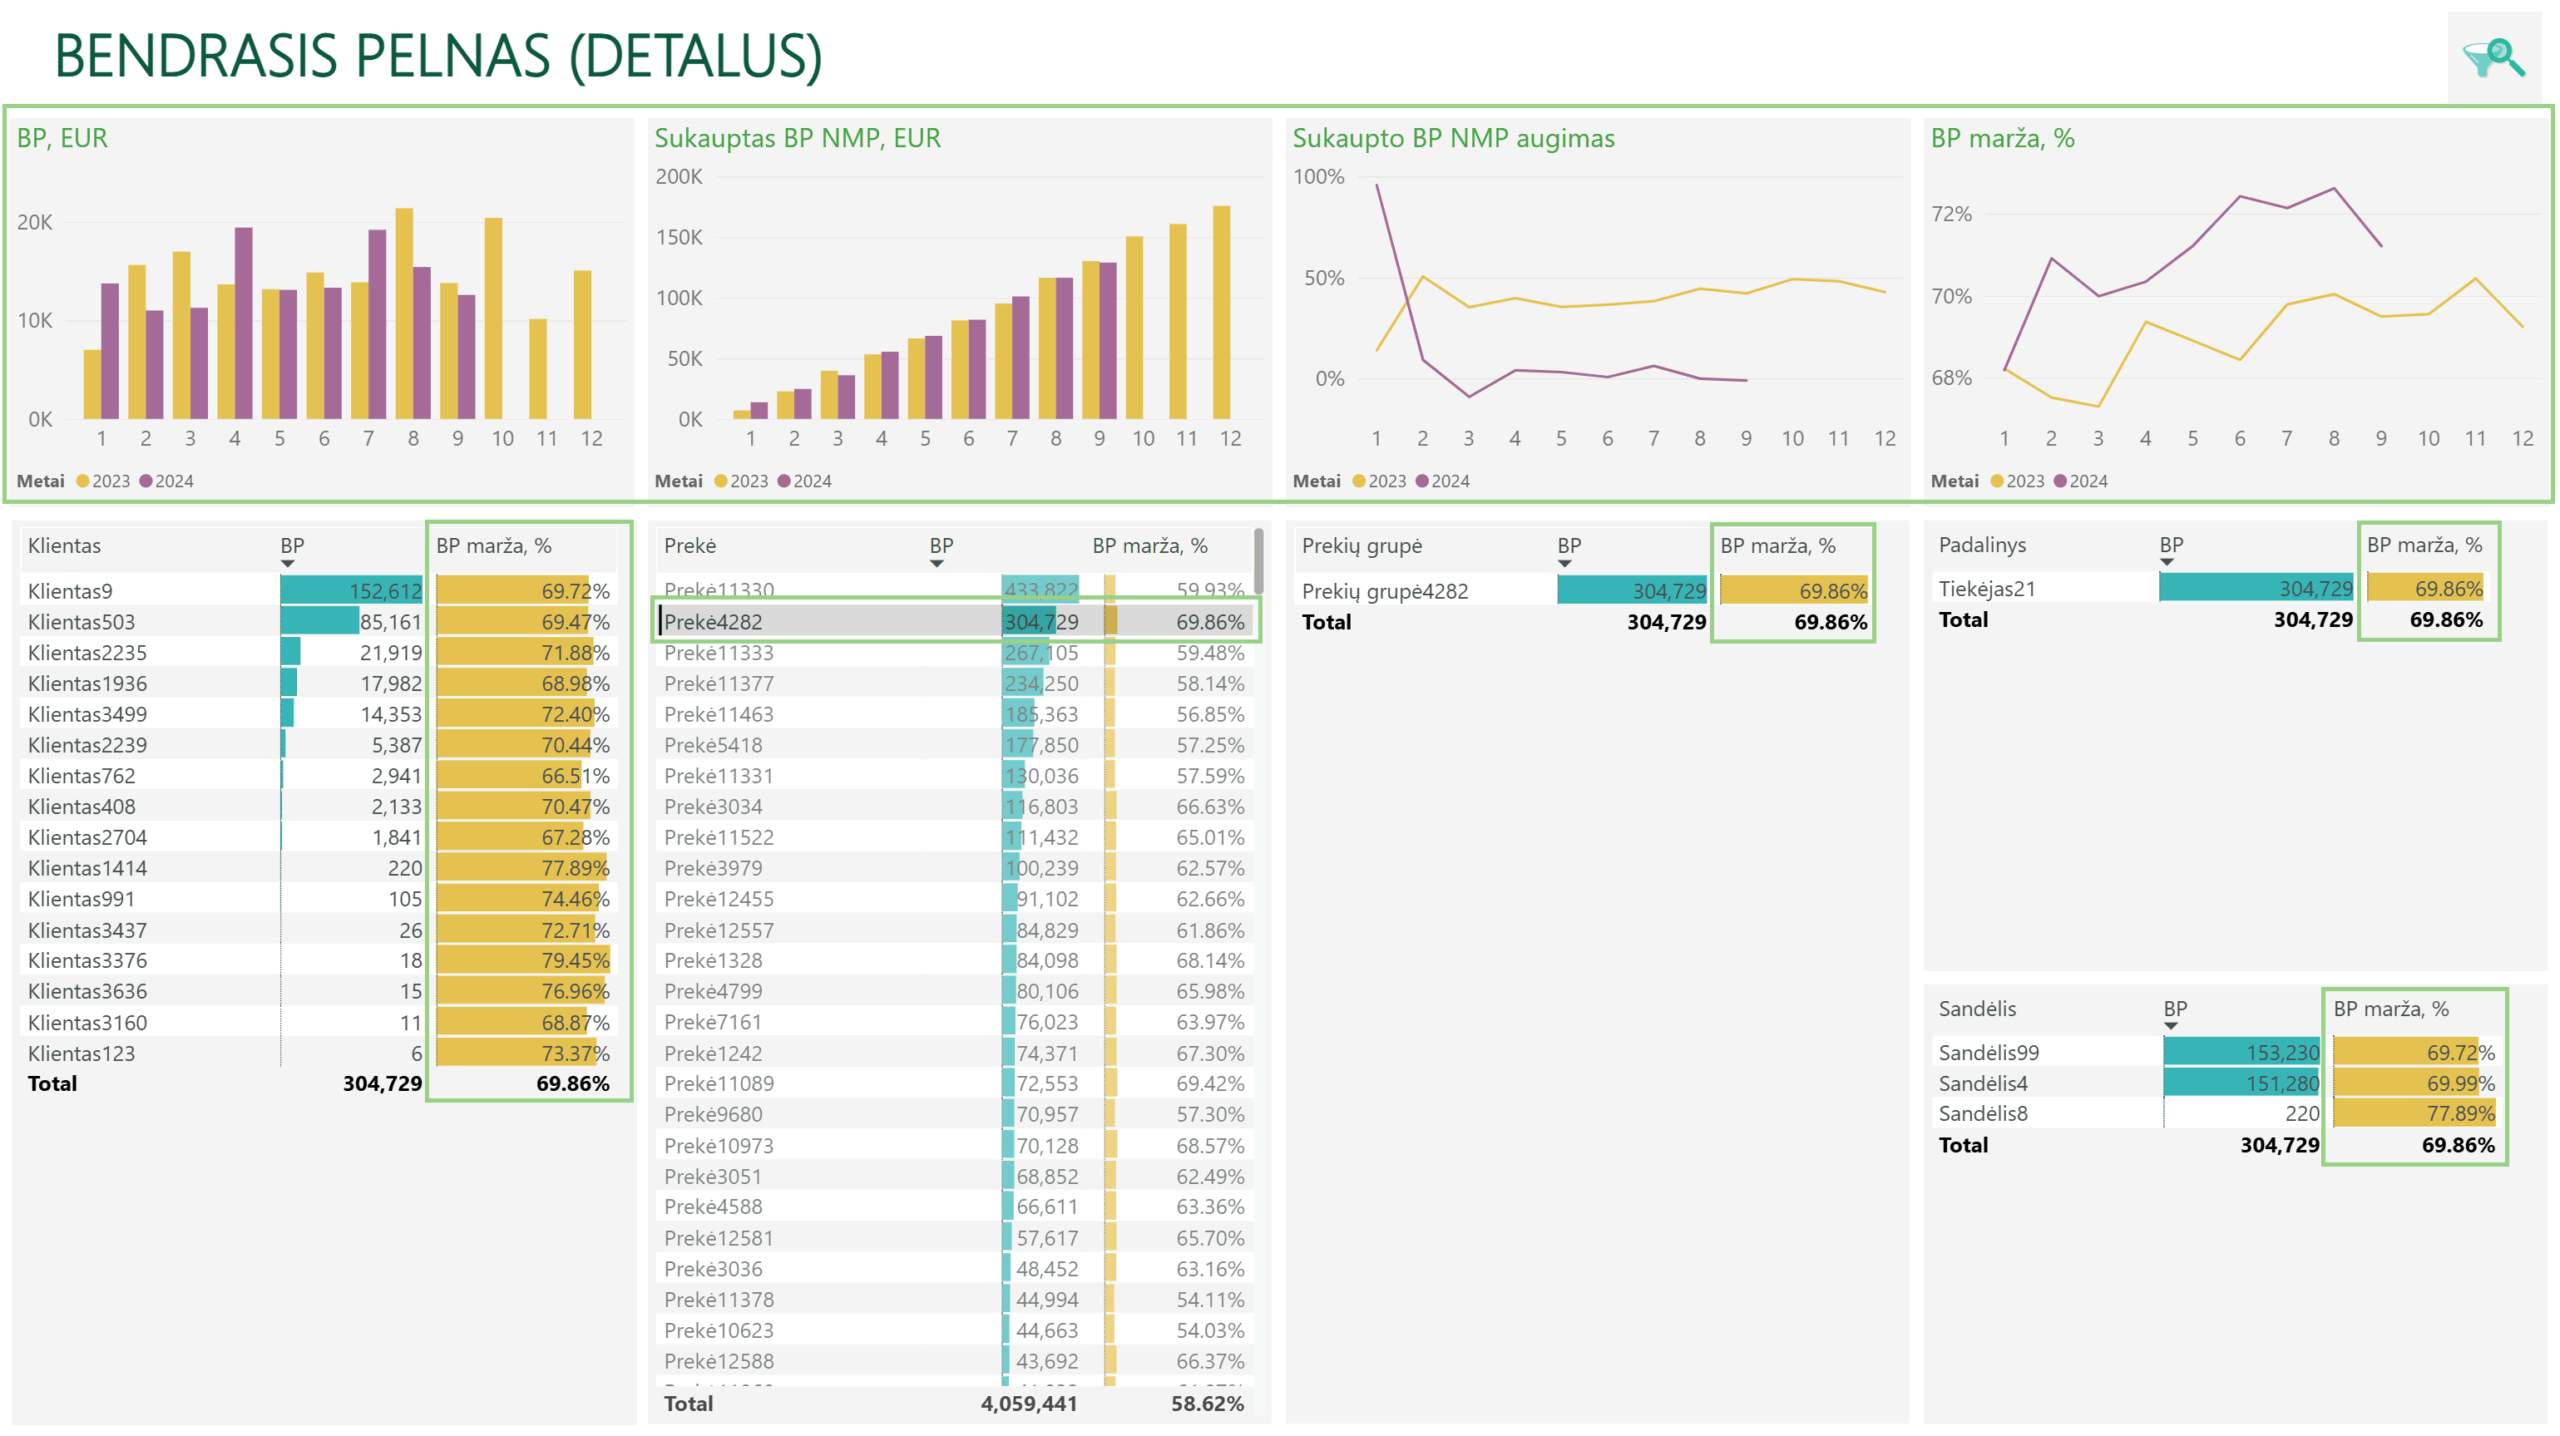
Using the same approach, you can select a specific customer and analyze the gross profit and margins of the products they purchased. This provides a clearer understanding of where sales growth is accompanied by an increase in gross profit and where higher revenue is achieved at the expense of declining margins.
Depending on the company’s business model and available data, discounts can also be analyzed in greater detail. For example, in wholesale businesses, it may be useful to track changes in a specific customer’s purchase volume and assess whether the discount they receive still meets the established criteria. Automating this type of analysis makes it easier to identify cases that may require review and use historical data to make more informed decisions about discount thresholds.
Why should financial and sales analytics be tailored to each company?
When choosing a sales analysis tool, financial analysis system, or Power BI solution for your business, it is important to look beyond the visual appearance of charts and dashboards. The value of analytics depends on whether it can answer the specific business and financial questions that matter to your company.
For one company, the main focus may be sales analysis by customers and products, while for another, it may be analysis by sales managers, regions, business units, or warehouses. Companies have different business models and use different accounting, ERP, CRM, and other systems, which means their data structures and analysis needs also vary.
For this reason, PLY Business tailors its Power BI analytics to the specific needs of each company. Depending on the business model, available data, and analysis requirements, the analytical dimensions, calculated metrics, and report structure may all differ. This reflects the broader approach behind PLY Business solutions: financial and business analytics are tailored to the structure and needs of each individual business rather than being based on a standard reporting template.
Therefore, Power BI report development goes beyond creating a standard sales dashboard. Depending on the company’s needs and available data, analytics can be tailored to address specific business questions – for example, through more detailed analysis of sales, profitability, customer purchasing behavior, or discounts. The goal is for reports not only to show the results, but also to provide a better understanding of what drove them, turning these insights into a foundation for data-driven business decisions.
When is it worth automating sales and financial reporting?
Automating sales and financial reporting is not always necessary. When data volumes are small, there are only a few data sources, and reports do not need to be updated frequently, Excel may be perfectly sufficient for analysis.
However, in many companies, reporting becomes a repetitive process: data is exported from accounting, ERP, CRM, or other systems, transferred to Excel, combined and recalculated, and new versions of reports are prepared periodically. Even more time is required when the overall results raise additional questions – why did sales decline, which customers or products had the greatest impact, and how did profitability change during the same period?
By automating data collection and report updates, Power BI analytics can become an ongoing business management tool rather than just a report prepared periodically. Sales and financial metrics that are updated regularly can be monitored on a daily basis, eliminating the need to wait for the next reporting cycle to identify a significant change. Changes can be identified sooner, their causes analyzed, and appropriate action taken when necessary.
Learn more about connecting data sources and automating reports: “Power BI integration: how company data is turned into analytics”.
If you are looking for a Power BI solution for financial analysis and reporting automation, contact us.


