

Cash flow analysis with Power BI: why is the company profitable but short on cash?
A company’s sales may be growing and its profit and loss statement may show strong results, while at the same time its cash balance is declining. This does not necessarily mean that the company’s performance is deteriorating – profit and cash flow reflect different aspects of financial performance.
Revenue and expenses are not always recognized in accounting at the same time as the related cash is actually received or paid. Because of these timing differences, some of the company’s cash is tied up in working capital. In addition, cash may be used for investments or other business needs.
Cash flow analysis is therefore useful not only for explaining changes that have already occurred. A company also needs to understand how much cash its core operations generate, where additional cash needs arise, how those needs are financed, and whether it will be able to meet its obligations on time. Historical analysis should also be complemented by forward-looking cash flow planning.
How does cash move through a company?
A bank account balance alone does not explain what caused a change in cash. Cash may increase because of stronger cash flow from core operations, but the balance may also rise because the company received a loan or sold an asset. Likewise, a decrease in cash does not necessarily indicate deteriorating performance – the company may have invested, repaid a loan, or financed an increase in working capital.
For this reason, the cash flow statement classifies cash flows into operating, investing, and financing activities. This classification helps explain not only the overall change in cash but also where that change came from.
Operating cash flow reflects cash movements related to the company’s core business activities. Over a longer period, it is useful to assess how much cash the core business generates, how this changes in relation to the company’s profit, and how changes in working capital affect operating cash flow.
Investing cash flow reflects cash movements related to the acquisition and disposal of long-term assets and other investments. Negative investing cash flow is not necessarily a bad sign – companies need to replace depreciating long-term assets over time and may also invest in business expansion. When assessing investments, it is important to consider the cash requirements they create, how those requirements are financed, and, in the case of expansion, the returns they generate.
Financing cash flow reflects cash movements related to the company’s financing and capital – for example, receiving and repaying loans, shareholder contributions, or dividend payments. It helps explain how financing decisions and distributions to shareholders affect the company’s cash flows.
When assessing cash flows, both the result for a specific period and changes over a longer time horizon are relevant. A single month can be significantly affected by a large customer payment, a substantial payment to a supplier, an investment, or a new loan. Longer-term analysis helps distinguish one-off changes from emerging trends. Power BI reports present cash flow changes visually over a selected period, making it easier to identify significant deviations and analyze their causes.
As part of the initial implementation of a PLY Business Power BI solution, a cash flow report is created. The report breaks down total cash flow into operating, investing, and financing cash flows, while the analysis can be further detailed down to individual cash flow items and, where needed, to the general ledger account level.
This makes it possible to move from the overall change in cash flow to the specific components behind it and identify what had the greatest impact on the company’s cash flow during the selected period.
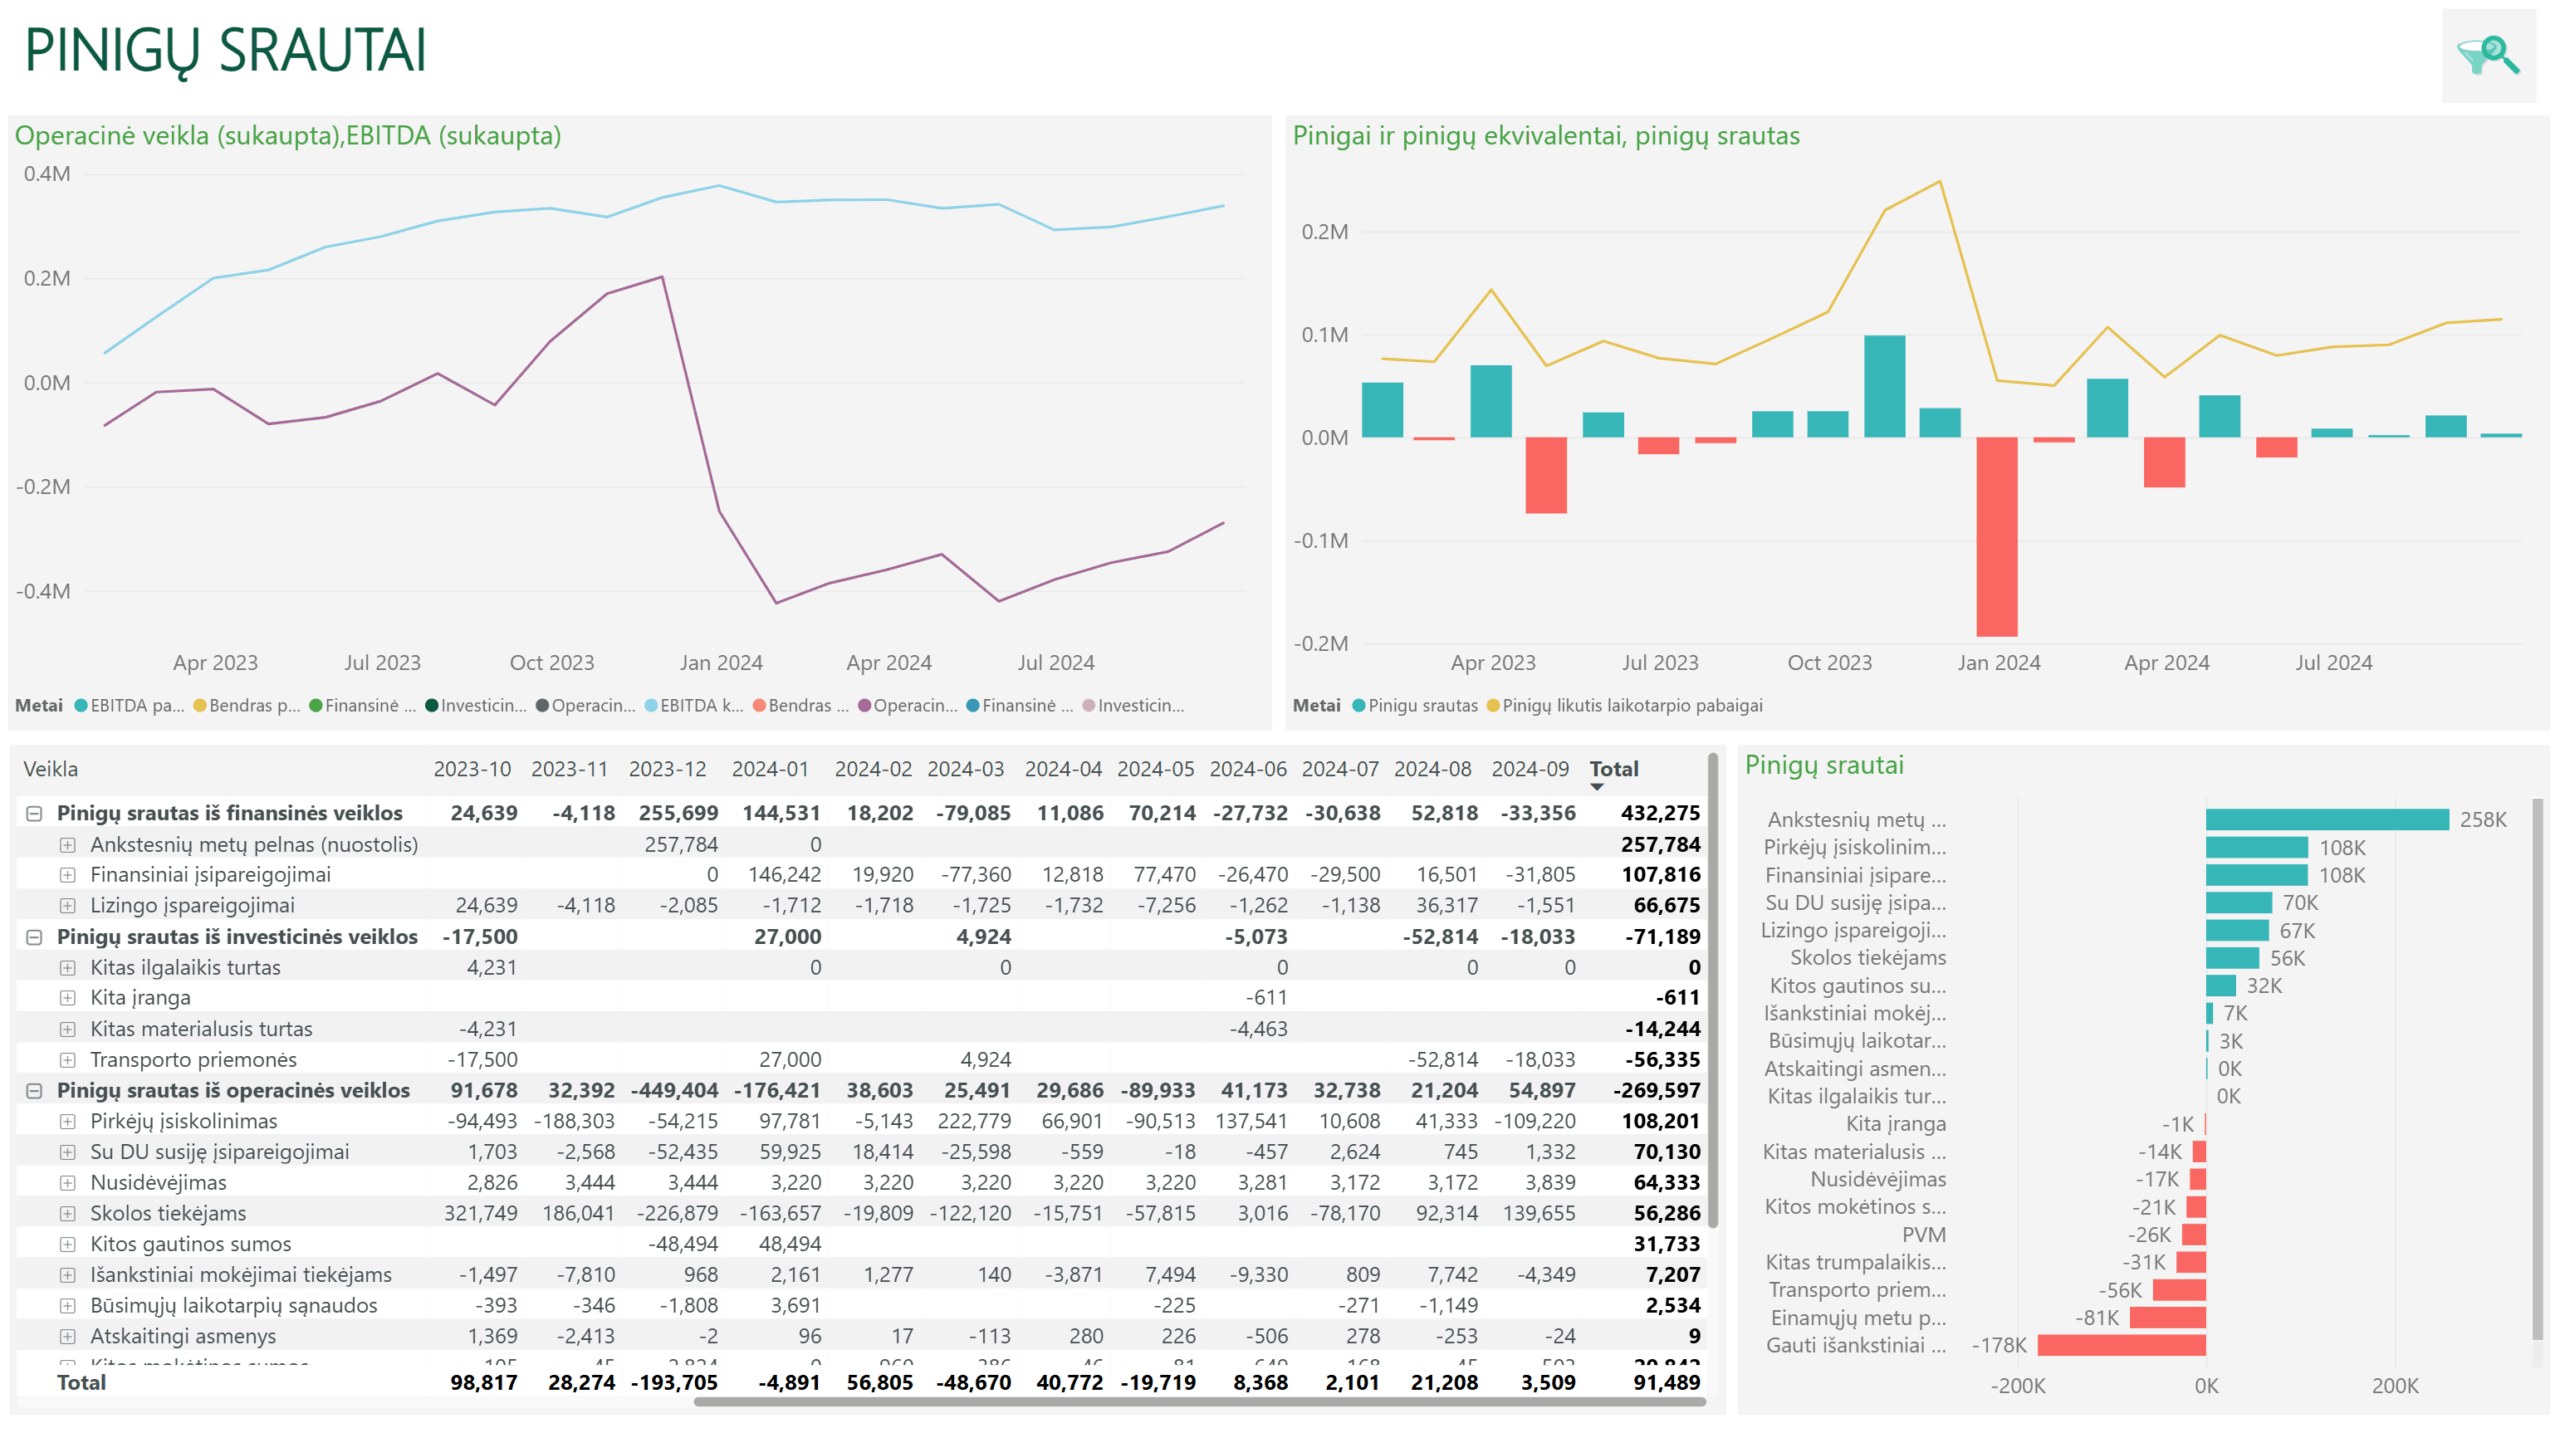
Profit and cash flow are not the same because revenue and expenses recognized in the profit and loss statement do not always coincide with when the company actually receives or pays cash. When analyzing this difference, changes in working capital and investments are particularly important.
One of the main sources of this difference is working capital. A company may sell goods and recognize revenue even though the customer has not yet paid. In this case, the sale has already contributed to the period’s financial result, but the cash will be received later. Similarly, growing inventory levels can increase cash requirements – the cash has already been spent to purchase the inventory, but it will only generate sales in the future. Meanwhile, longer payment terms with suppliers can defer part of this cash requirement.
The difference between profit and cash flow can become particularly pronounced as a company grows. Growth in sales and profit may be accompanied by higher accounts receivable and greater inventory requirements, meaning that part of the cash generated by operations is used to finance the increase in working capital.
A practical way to assess this difference is to compare EBITDA with operating cash flow. In the PLY Business Power BI report, both metrics are presented in a single chart, making it easy to track their movements and the gap between them over a selected period. A significant divergence between operating cash flow and EBITDA provides a reason to examine changes in working capital and its individual components in greater detail.
Another important factor is investment. When a company acquires long-term assets, the cash is spent at the time of the investment, while the cost of the asset is generally recognized gradually in the profit and loss statement through depreciation or amortization. As a result, the impact of an investment on cash flow and profit occurs in different periods.
Investments also tend to be uneven over time. A company may invest relatively little in one year and make significant asset replacements or expand its operating capacity in another. As a result, investment expenditure in a particular period can differ significantly from depreciation and amortization expense recognized during the same period.
Because of these differences, the profit and loss statement and the cash flow statement complement each other: one shows the company’s financial performance, while the other shows how its cash actually changed during the period.
Where does cash get tied up in working capital?
When analyzing cash flows, it is not enough to focus solely on the final operating cash flow figure. It is equally important to understand how that result was generated.
An indirect-method cash flow statement helps explain this by showing how accounts receivable, inventory, accounts payable, and other working capital components affect operating cash flow. This is the approach PLY Business typically uses when preparing a cash flow report as part of the initial Power BI implementation.
However, working capital should not be analyzed solely in terms of how changes in it affect cash flow. It is also important to assess whether the overall level of working capital is appropriate and how efficiently its individual components are managed.
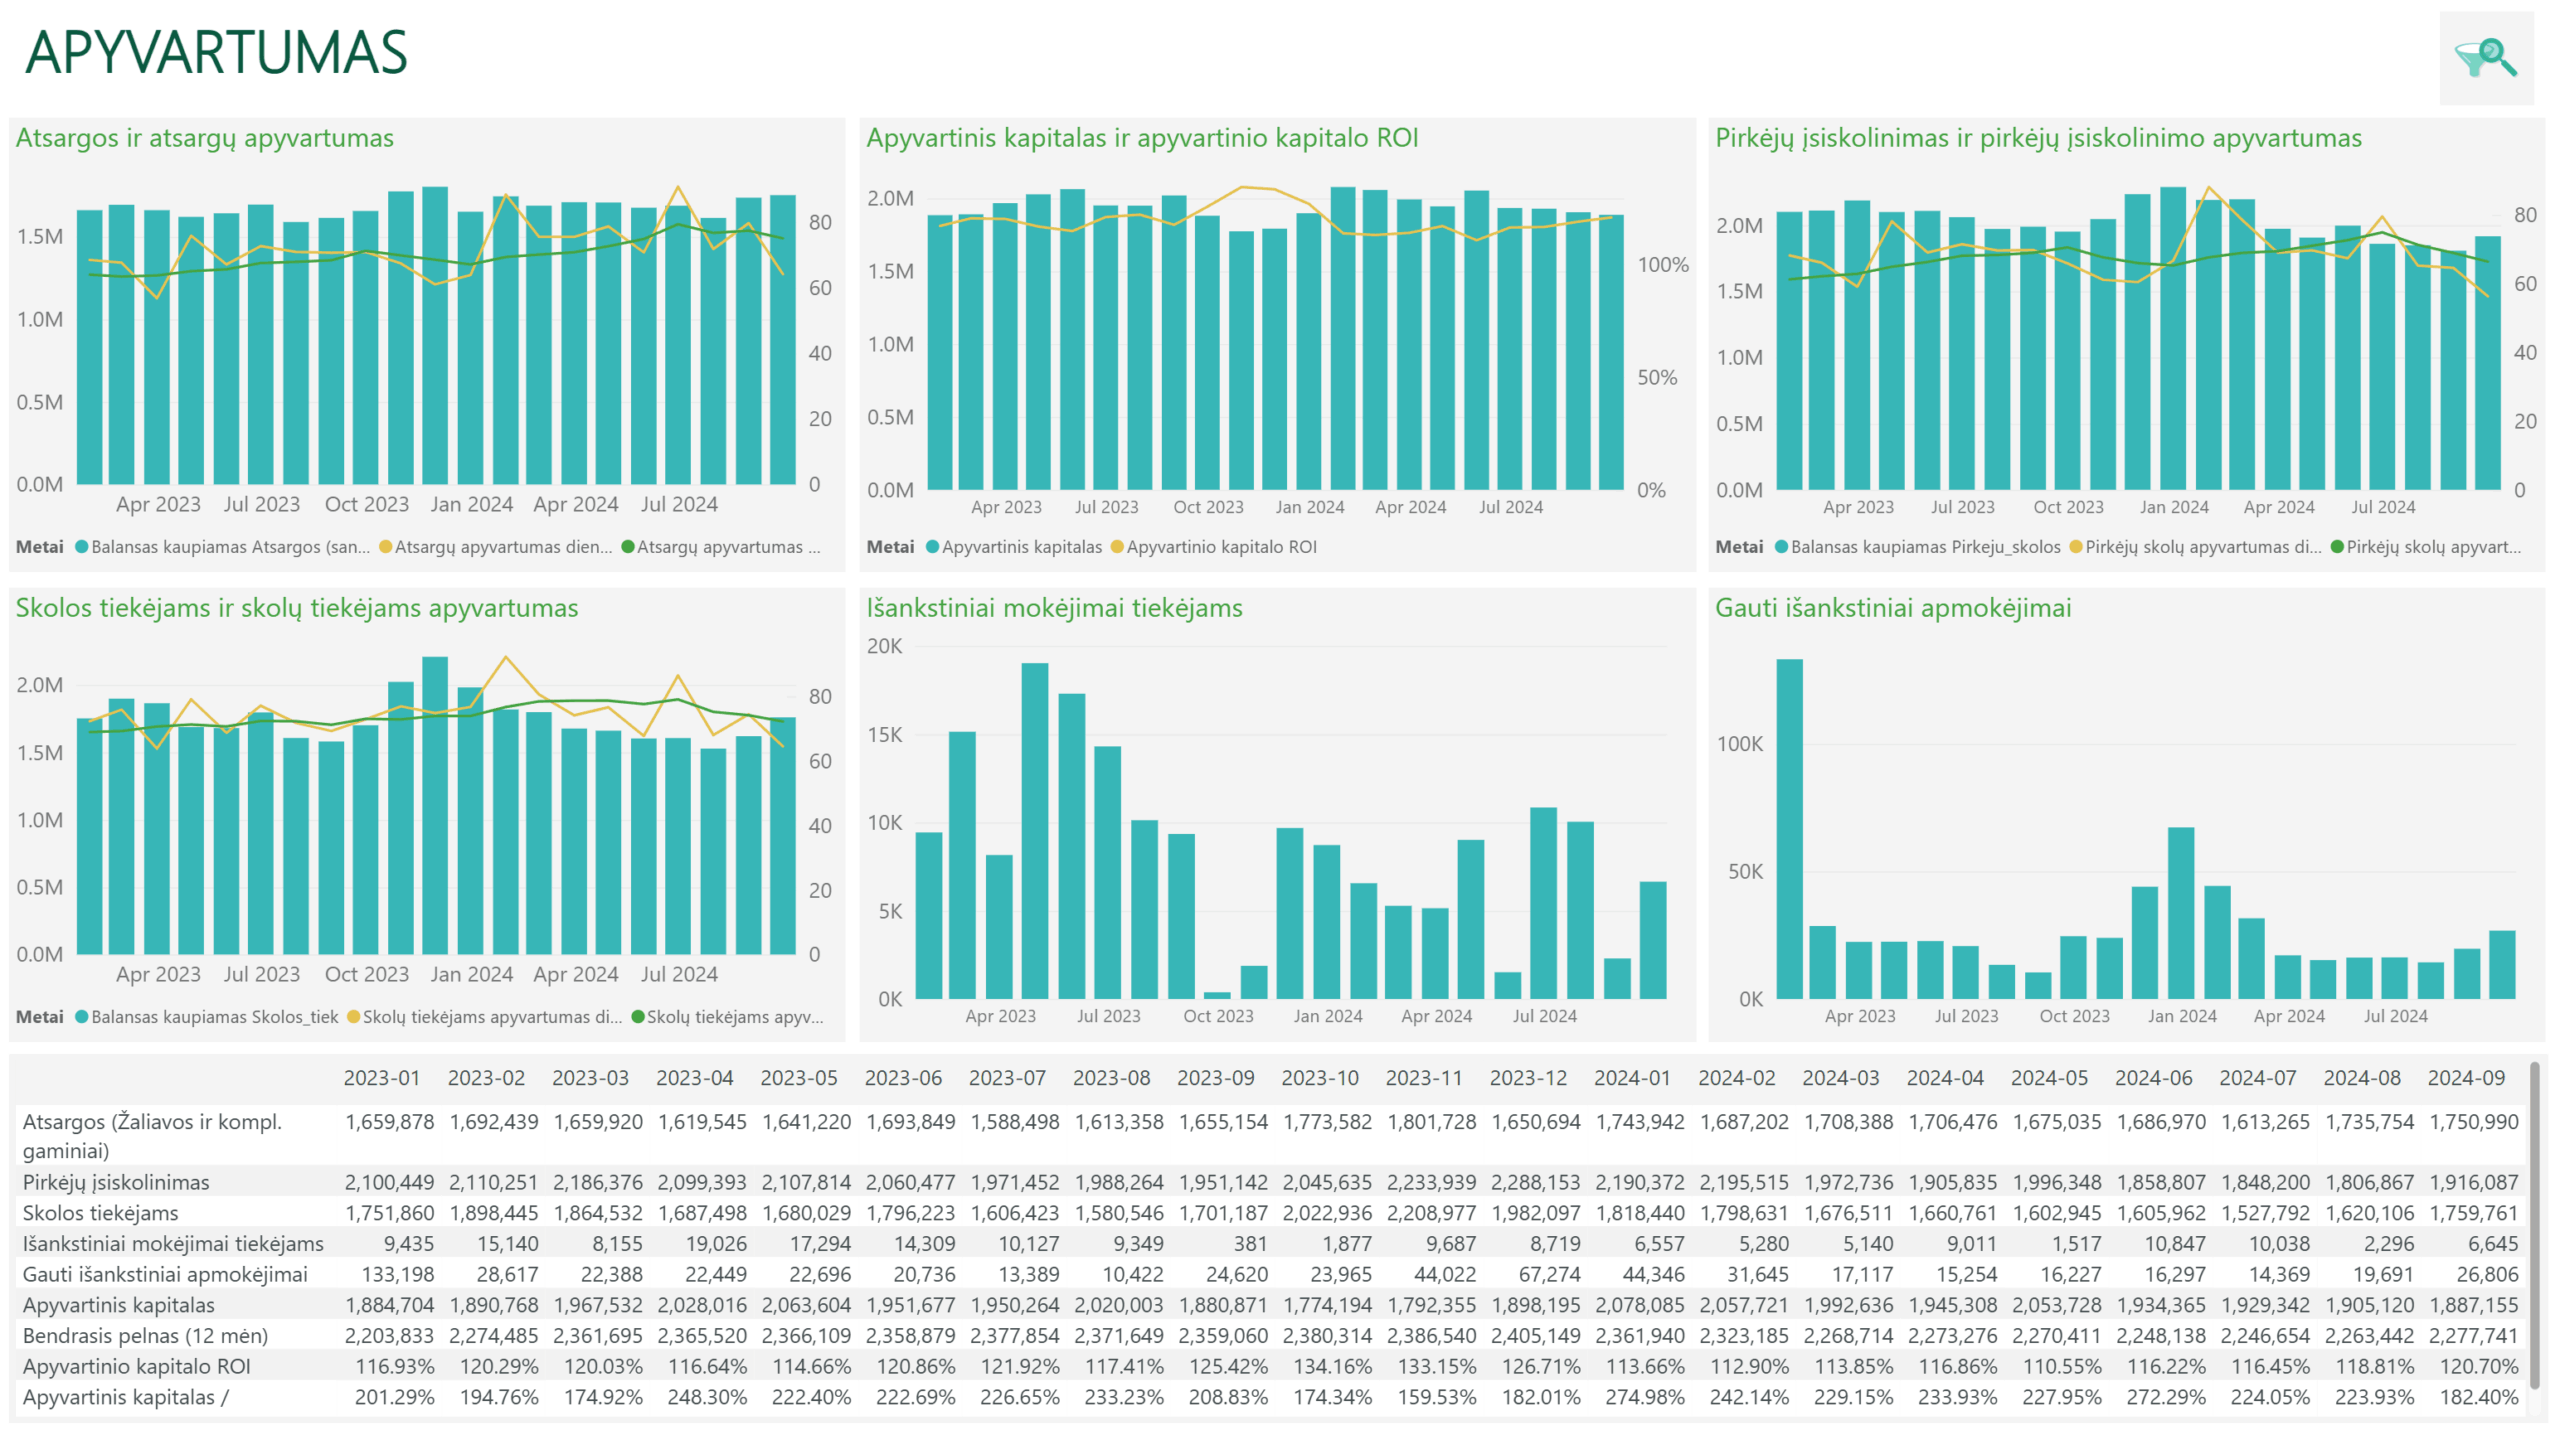
For this reason, it is useful to analyze not only the amount of working capital but also the turnover of its individual components. Accounts receivable turnover indicates how quickly customers pay on average, inventory turnover shows how quickly inventory is sold, and accounts payable turnover indicates how quickly the company pays its suppliers on average. These metrics should be assessed in the context of their trends, the company’s business model, and agreed payment terms.
In PLY Business analytics, overall working capital efficiency can also be assessed using working capital ROI, which relates the working capital employed in the business to the return it generates.
As part of the initial implementation of a PLY Business Power BI solution, a turnover report is created that brings together inventory, accounts receivable, and accounts payable balances and turnover metrics, as well as total working capital and its ROI. When a significant change is identified, the analysis can be continued in dedicated reports – for example, accounts receivable can be broken down by customer and invoice, while inventory can be analyzed by individual product, stock level, and sales rate.
Inventory: how much cash is held in stock?
Growing inventory levels can increase a company’s working capital requirements, but the total value of inventory alone is not enough to determine whether those levels are appropriate. Inventory turnover and the relationship between stock levels and the pace of sales also need to be considered.
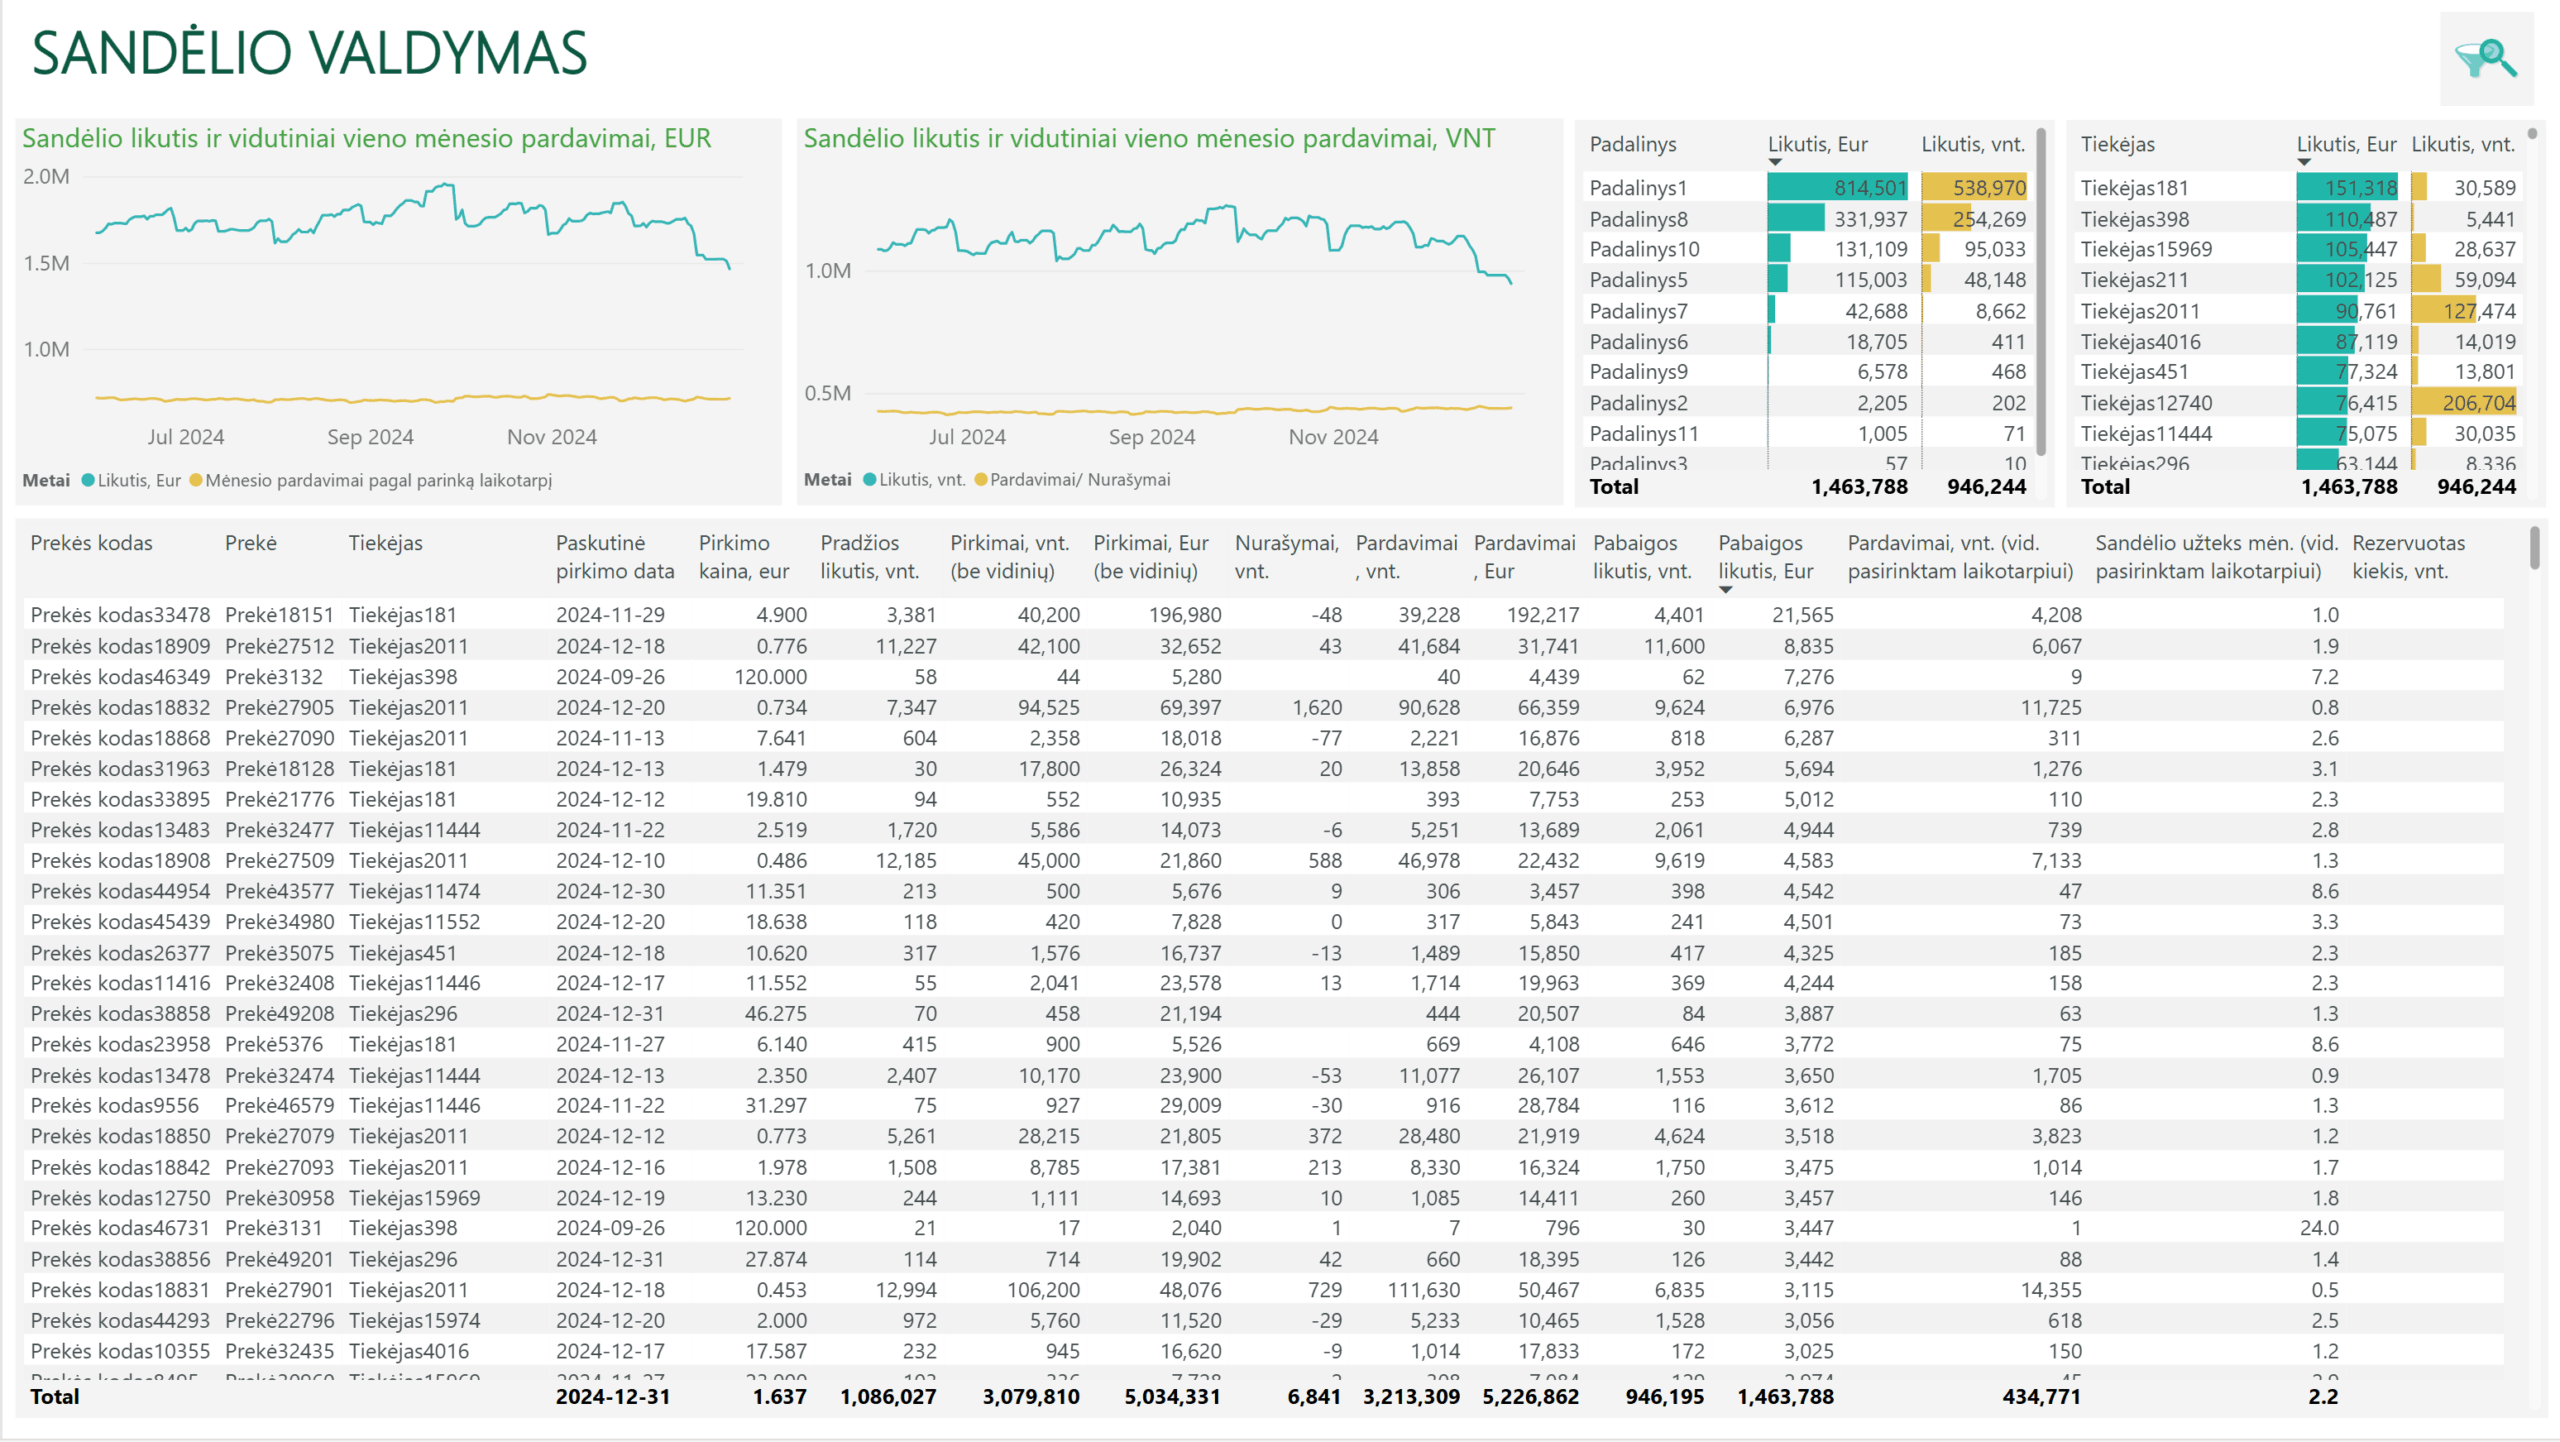
In the PLY Business Power BI inventory management report, changes in inventory levels are compared with average sales, while the data can be analyzed across dimensions relevant to the company, such as suppliers or business units. More detailed analysis includes individual product stock levels, purchases, sales, and other relevant information.
One practical metric shows how many months the current inventory would last based on the recent sales rate. It helps identify products with disproportionately high stock levels, as well as those whose inventory is declining and may need to be reordered.
This type of analysis is therefore useful for more than assessing financial performance. Purchasing and inventory management teams can use it to plan stock replenishment and future purchases.
Accounts receivable: how quickly do sales turn into cash?
A sale may be recorded and revenue recognized, but the company receives the cash only when the customer pays. Therefore, growing accounts receivable can be one of the reasons why operating cash flow does not increase at the same pace as the company’s profit.
When assessing accounts receivable, the total balance is not the only relevant factor. It is also important to consider how quickly customers pay, the proportion of overdue receivables, and how these metrics change over time.
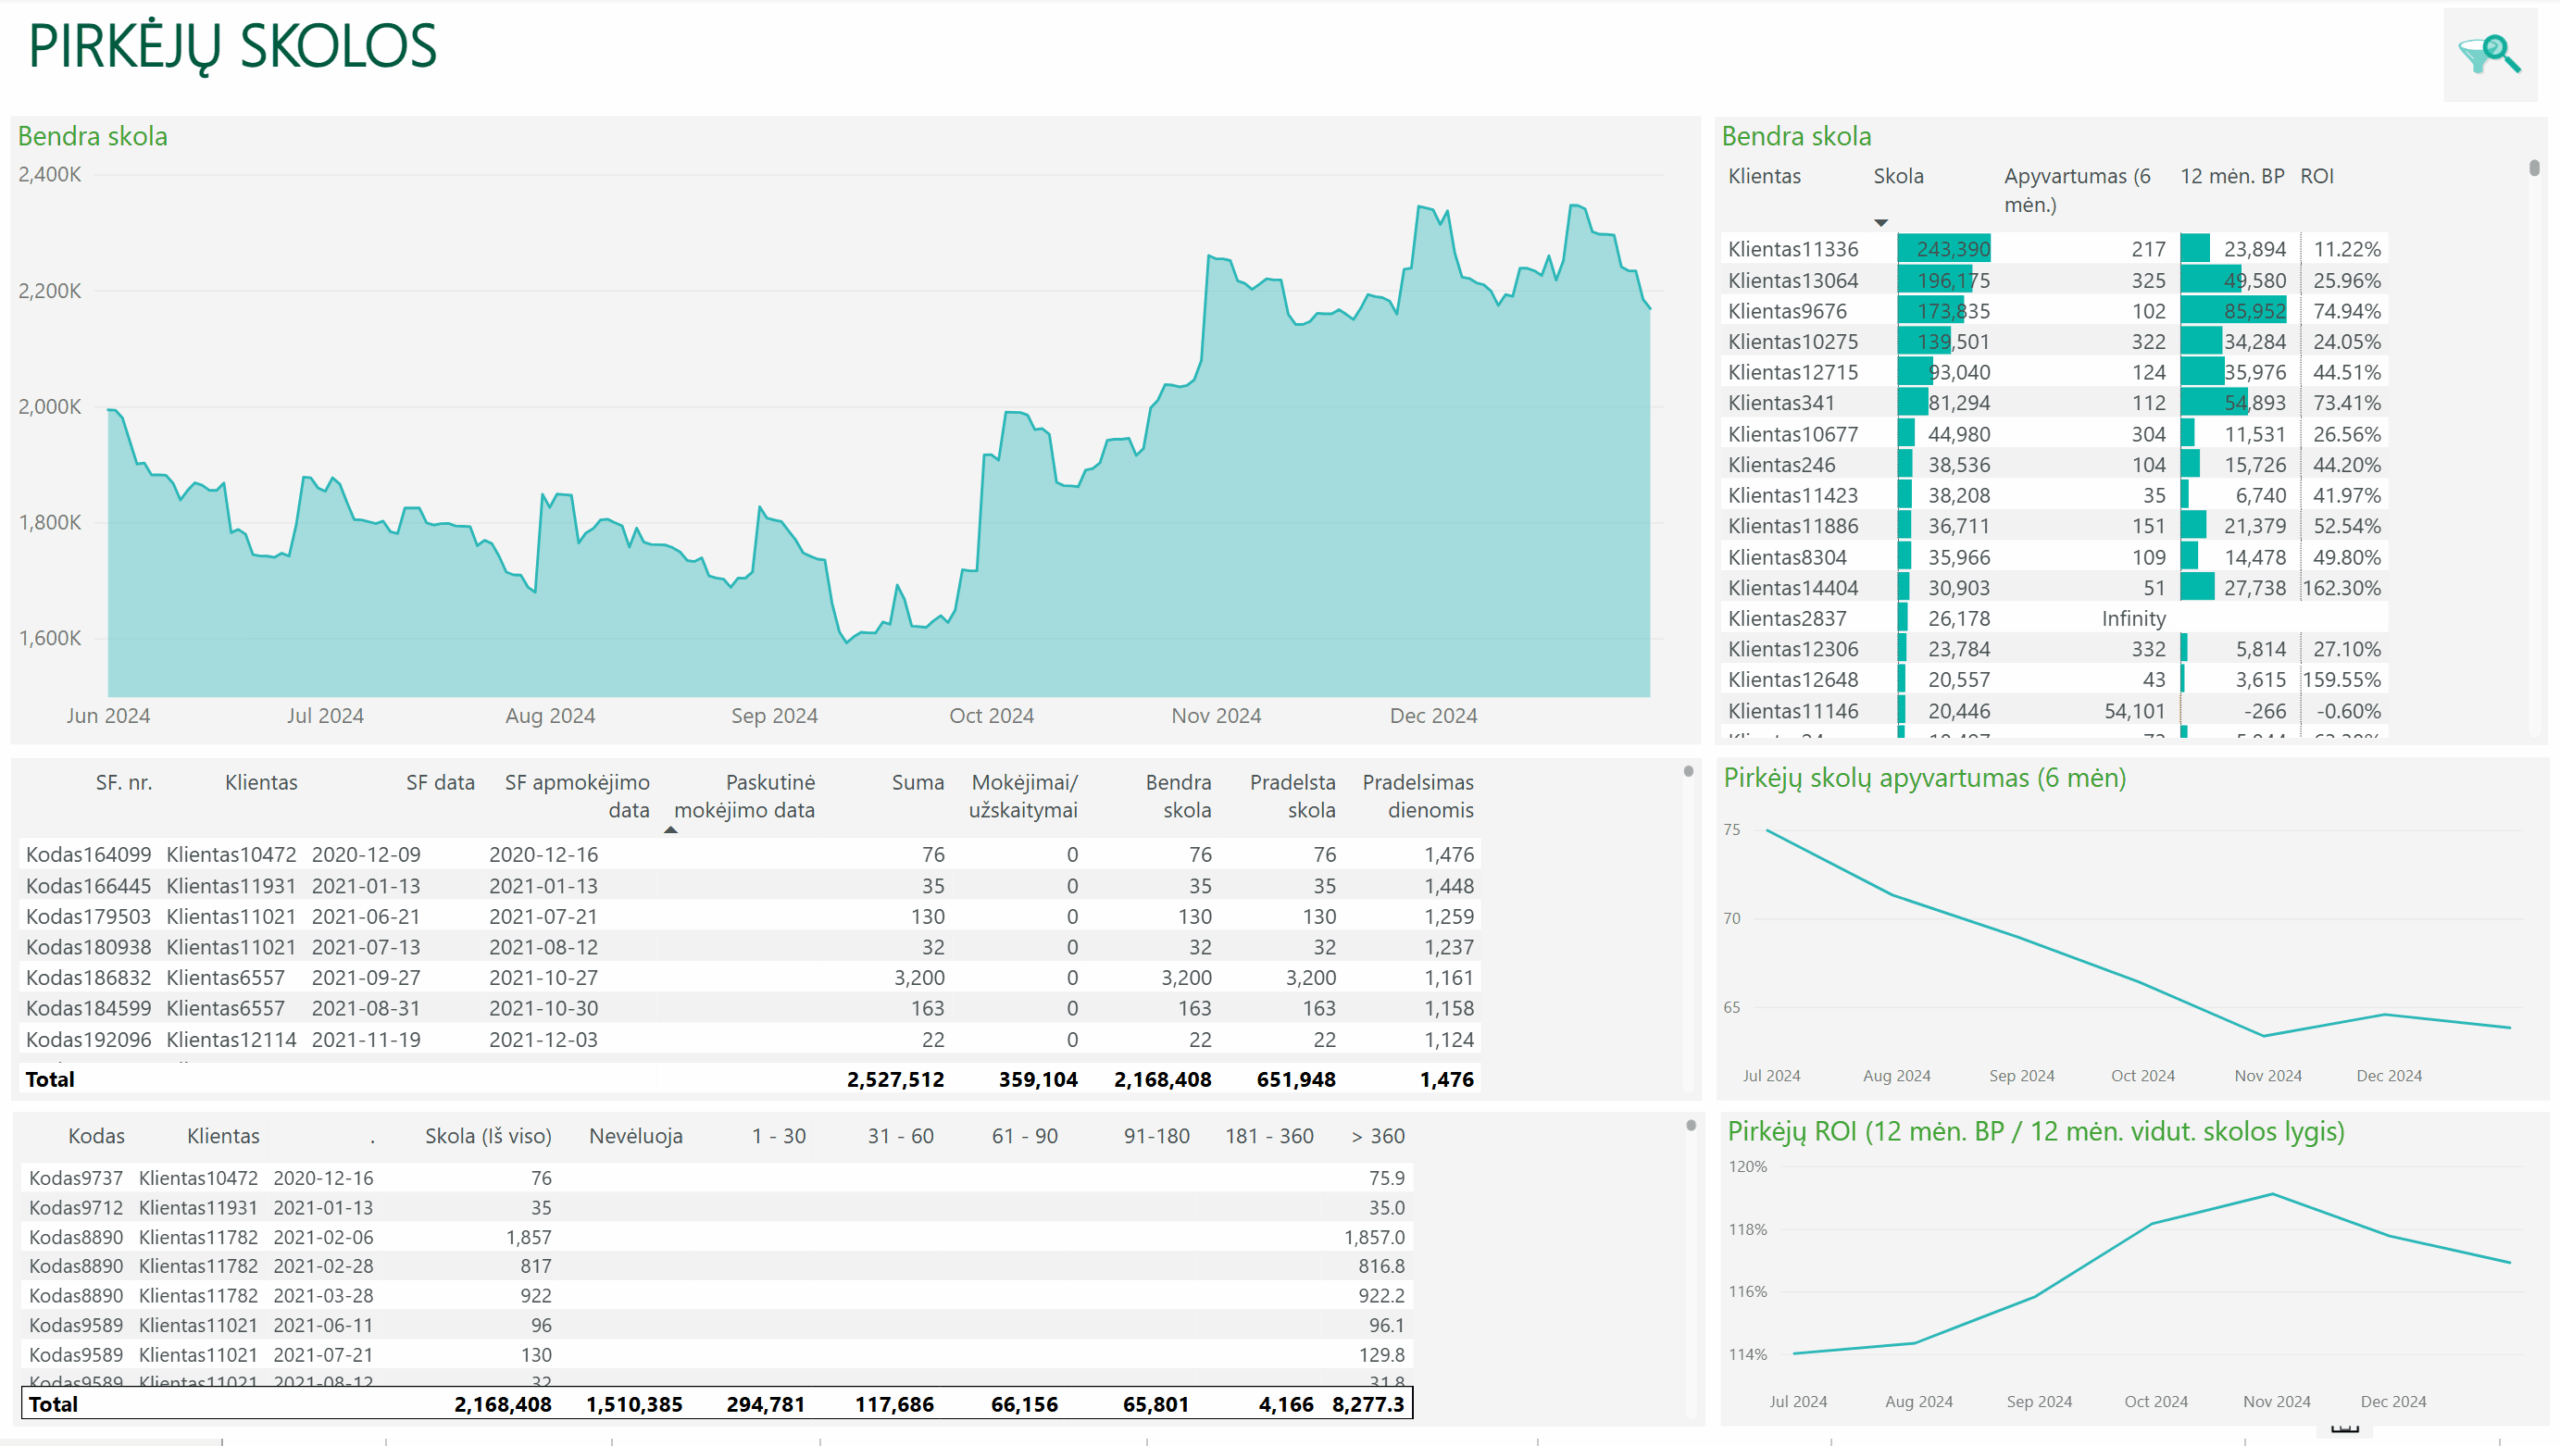
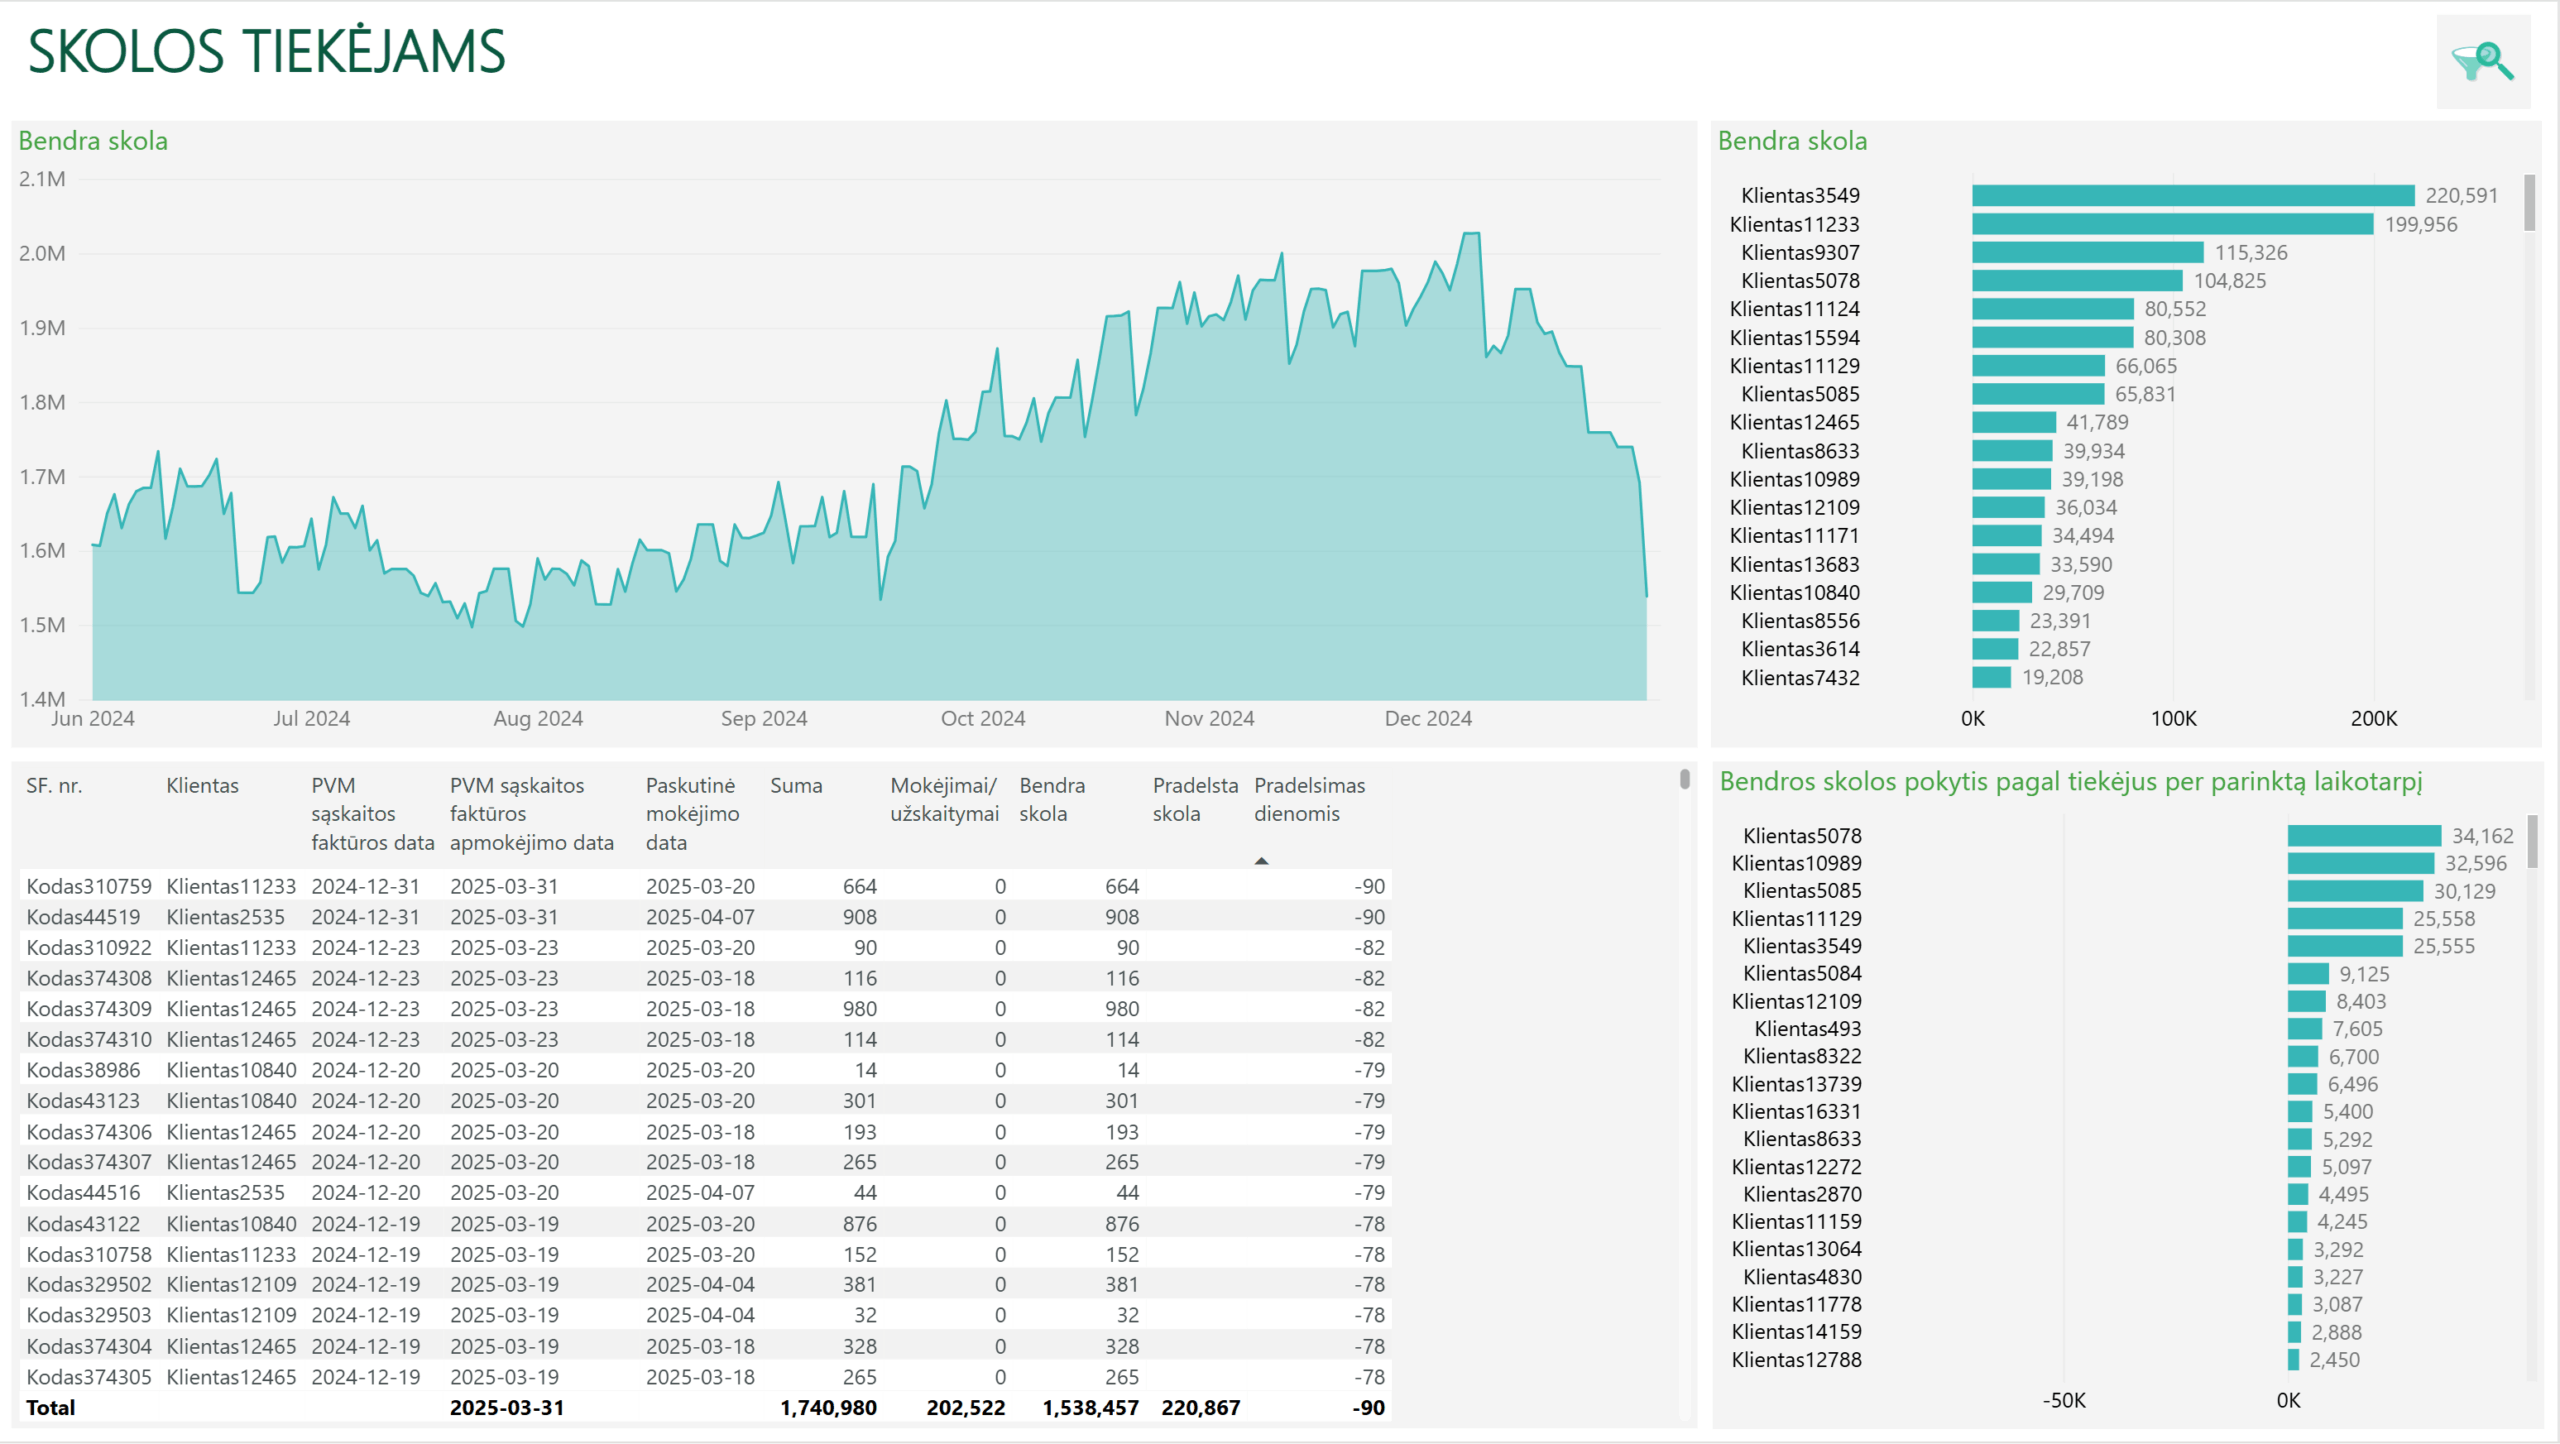
The PLY Business Power BI accounts receivable report allows users to move from the total receivables balance and its turnover to a specific customer and individual unpaid invoices, including payment due dates, outstanding and overdue amounts, and the number of days overdue.
Accounts receivable can also be analyzed alongside the gross profit generated by each customer by calculating customer ROI. This metric provides an additional perspective for assessing the relationship between the trade credit extended to a customer and the return generated from that customer.
This information is also useful for day-to-day receivables management – helping identify customers who should be reminded about unpaid invoices, detect lengthening payment periods, and prioritize collection activities.
Accounts payable: how to plan upcoming payments?
Accounts payable affect both a company’s working capital and its cash requirements in the near term. Therefore, in addition to the total amount outstanding, the due dates of individual invoices are also relevant.
The PLY Business Power BI accounts payable report shows the overall trend in liabilities, their distribution by supplier, and changes over a selected period. By selecting a specific supplier, the analysis can be broken down to individual invoices, including their due dates, outstanding amounts, and overdue status.
This information is useful for ongoing payment planning. Upcoming and overdue obligations help determine payment priorities and plan payments according to their due dates. Assessing these obligations alongside expected cash inflows makes it easier to estimate the company’s cash requirements for the coming periods.
How does Power BI analytics help manage cash flow and working capital?
Managing cash flow and working capital requires more than simply having access to data – it is important to quickly turn that data into useful information for decision-making. In Power BI, accounting data is enhanced with calculated financial metrics and presented in interactive reports that help continuously track the company’s financial position.
Power BI integration also reduces the need for manual work. Instead of exporting data separately, performing additional calculations, or preparing Excel reports, companies can use automatically updated interactive reports. This helps identify deviations faster, understand their causes, and focus attention where action is needed.
This type of analytics is relevant not only to the finance team. PLY Business reports are customized to different business functions based on the company’s needs, allowing purchasing, sales, receivables management, and other responsible teams to use relevant information in their decision-making.
Continuously updated information also provides a basis for looking ahead. Expected customer payments, upcoming supplier payments, planned investments, and other obligations help assess future cash requirements. This is particularly relevant when planning investments or business expansion, as companies need to consider not only how much cash will be required but also how those needs will be financed and whether the company will be able to meet its financial obligations.
The value of Power BI integration therefore goes beyond automated reporting. It enables companies to use accounting data for continuous cash flow and working capital analysis and control, day-to-day business decisions, and planning future cash and financing requirements.


