

Company financial performance: how to identify problems and find ways to improve profitability
Growing sales revenue does not always translate into higher profits. Profitability may be negatively affected by costs of goods sold rising faster than revenue, increasing operating expenses, or changes in the sales structure. Even when a company’s overall financial performance is improving, individual products, services, or business segments may still be unprofitable. It is therefore important to understand which factors have the greatest impact on profitability and where opportunities for improvement may lie.
The Power BI reports developed by PLY Business enable companies to analyze sales revenue, cost of goods sold, gross profit, and operating expenses, compare changes over time, and assess the financial performance of individual business segments in greater detail. These reports are tailored to each company’s accounting structure and operational characteristics, helping businesses use their financial data to identify specific profitability issues and investigate their underlying causes.
Where to start when analyzing a company’s financial performance
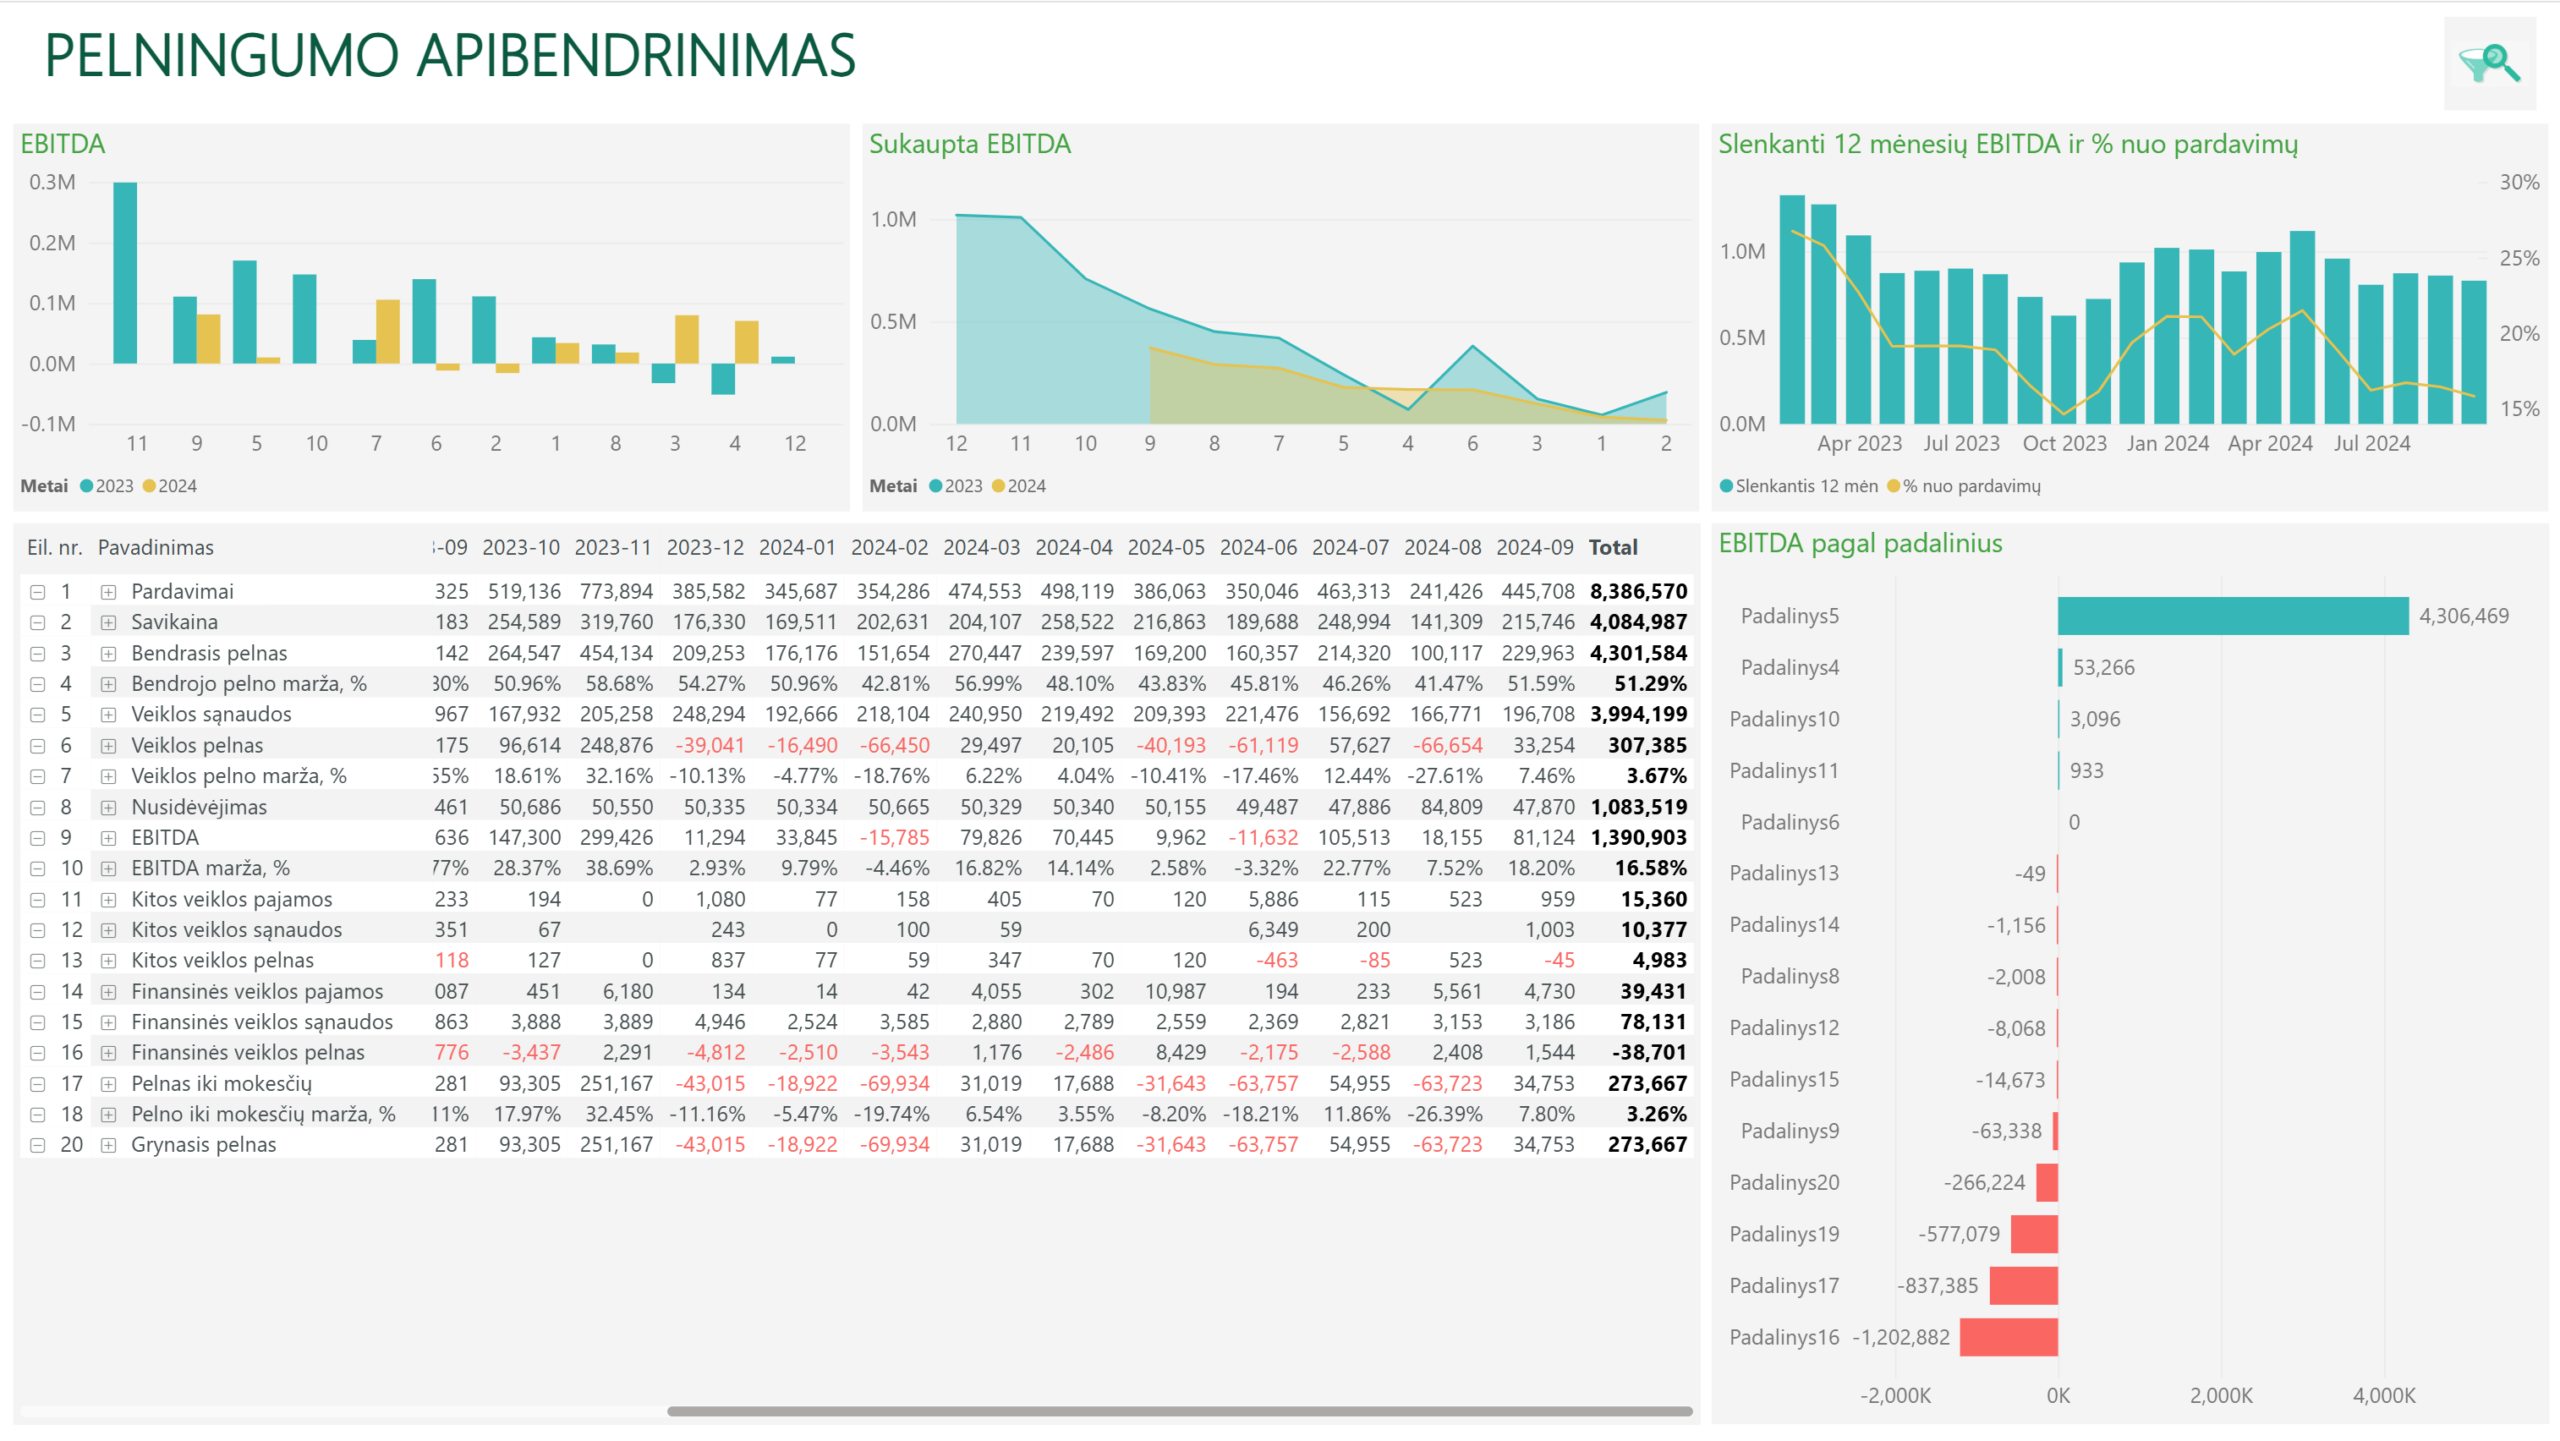
One way to begin analyzing financial performance is to review the company’s overall profit and loss (P&L) statement. Sales revenue, cost of goods sold, gross profit, operating expenses, EBITDA, and operating profit provide insight into the performance of core business operations and help identify the most significant changes.
When assessing a company’s overall financial performance, profit before tax and net profit are also important. This is particularly relevant for companies with substantial financial liabilities or investments in financial instruments. In such cases, interest expenses, investment income, or changes in investment values can have a significant impact on the final financial result.
The PLY Business Profitability Overview report brings together key financial indicators in one place, along with their trends, period-on-period comparisons, and calculated profit margins. This helps assess the company’s overall financial position and determine which areas warrant further investigation. For example, if sales revenue is increasing while gross profit is declining, it is worth examining changes in cost of goods sold, pricing, and sales mix. If gross profit is increasing but EBITDA is declining, operating expenses become one of the key areas for further analysis.
However, financial analysis does not necessarily have to begin with an overall profitability review. If an issue has already been identified in a specific business area, the analysis can start directly with the relevant report. The key is to ensure that the performance of individual business areas can be linked to the company’s overall financial picture.
How are sales changing?
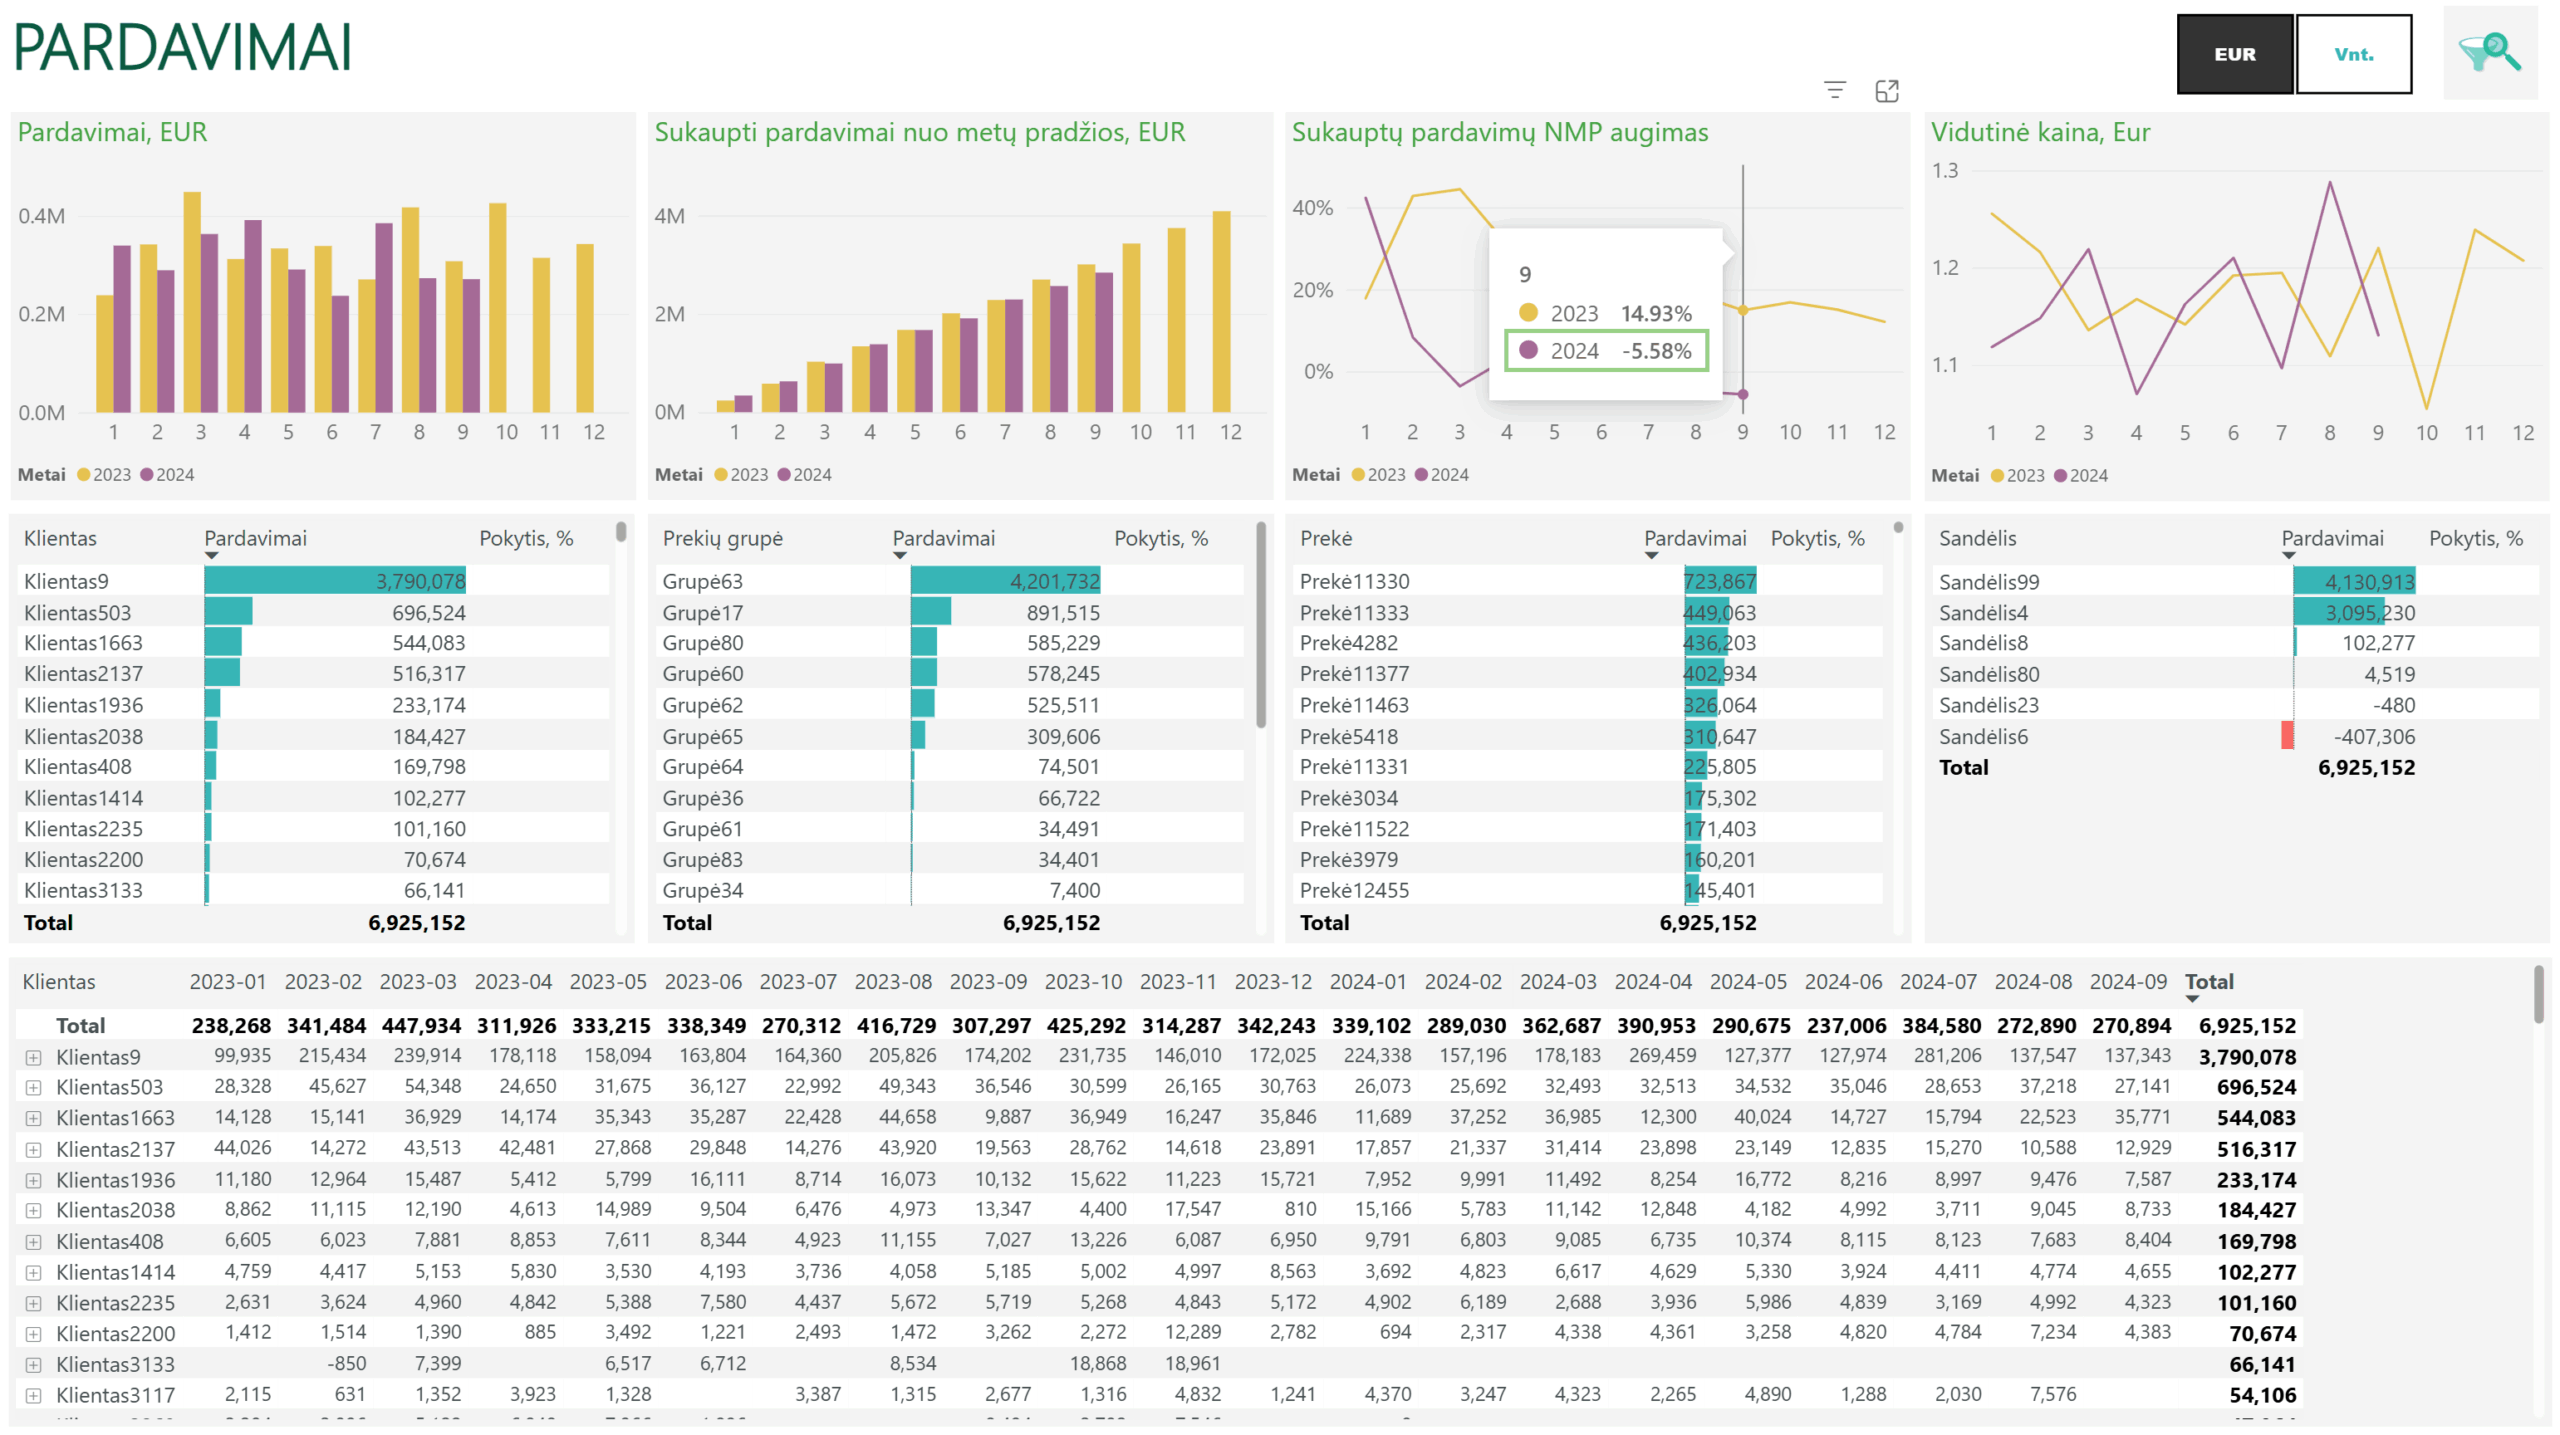
Changes in sales revenue can have a significant impact on a company’s financial performance. However, looking only at overall revenue growth or decline is not enough to assess this impact. It is important to identify which customers, products, product groups, or departments contributed to changes in sales and how the sales mix has evolved. This analysis supports data-driven decision-making by helping businesses identify which customer relationships require more attention, which products have potential for increased demand, and which business areas offer opportunities for growth.
Sales revenue may increase due to higher sales volumes, higher prices, or changes in the product mix. These factors can affect profitability in different ways, making it useful to assess sales performance alongside gross profit and gross profit margin.
Sales should be analyzed even when the company’s overall revenue is growing. Increased sales to a few major customers may conceal declining orders from others, while improved performance in some departments may mask deteriorating results elsewhere. Interactive Power BI reports make it easier to compare performance across different periods, identify negative trends, and highlight areas with potential for further sales growth.
Read more about sales analysis: “Sales analysis – more than just tracking sales revenue”.
Why can gross profit decline even when sales are growing?
An increase in sales revenue does not necessarily translate into higher gross profit. If the cost of goods sold increases faster than sales revenue, the gross profit margin declines. As a result, gross profit may grow more slowly than revenue or even decrease despite rising sales.
Such changes may be driven by higher raw material or product purchase prices, lower selling prices, increased discounts, or changes in the sales mix.
To identify the specific reasons behind these changes, it is useful to examine the breakdown of cost of goods sold and gross profit across different business segments. These analyses complement each other: the first helps explain changes in costs, while the second helps identify changes in the profitability of individual products, customers, or business areas.
Cost of goods sold analysis: which cost categories are driving the changes?
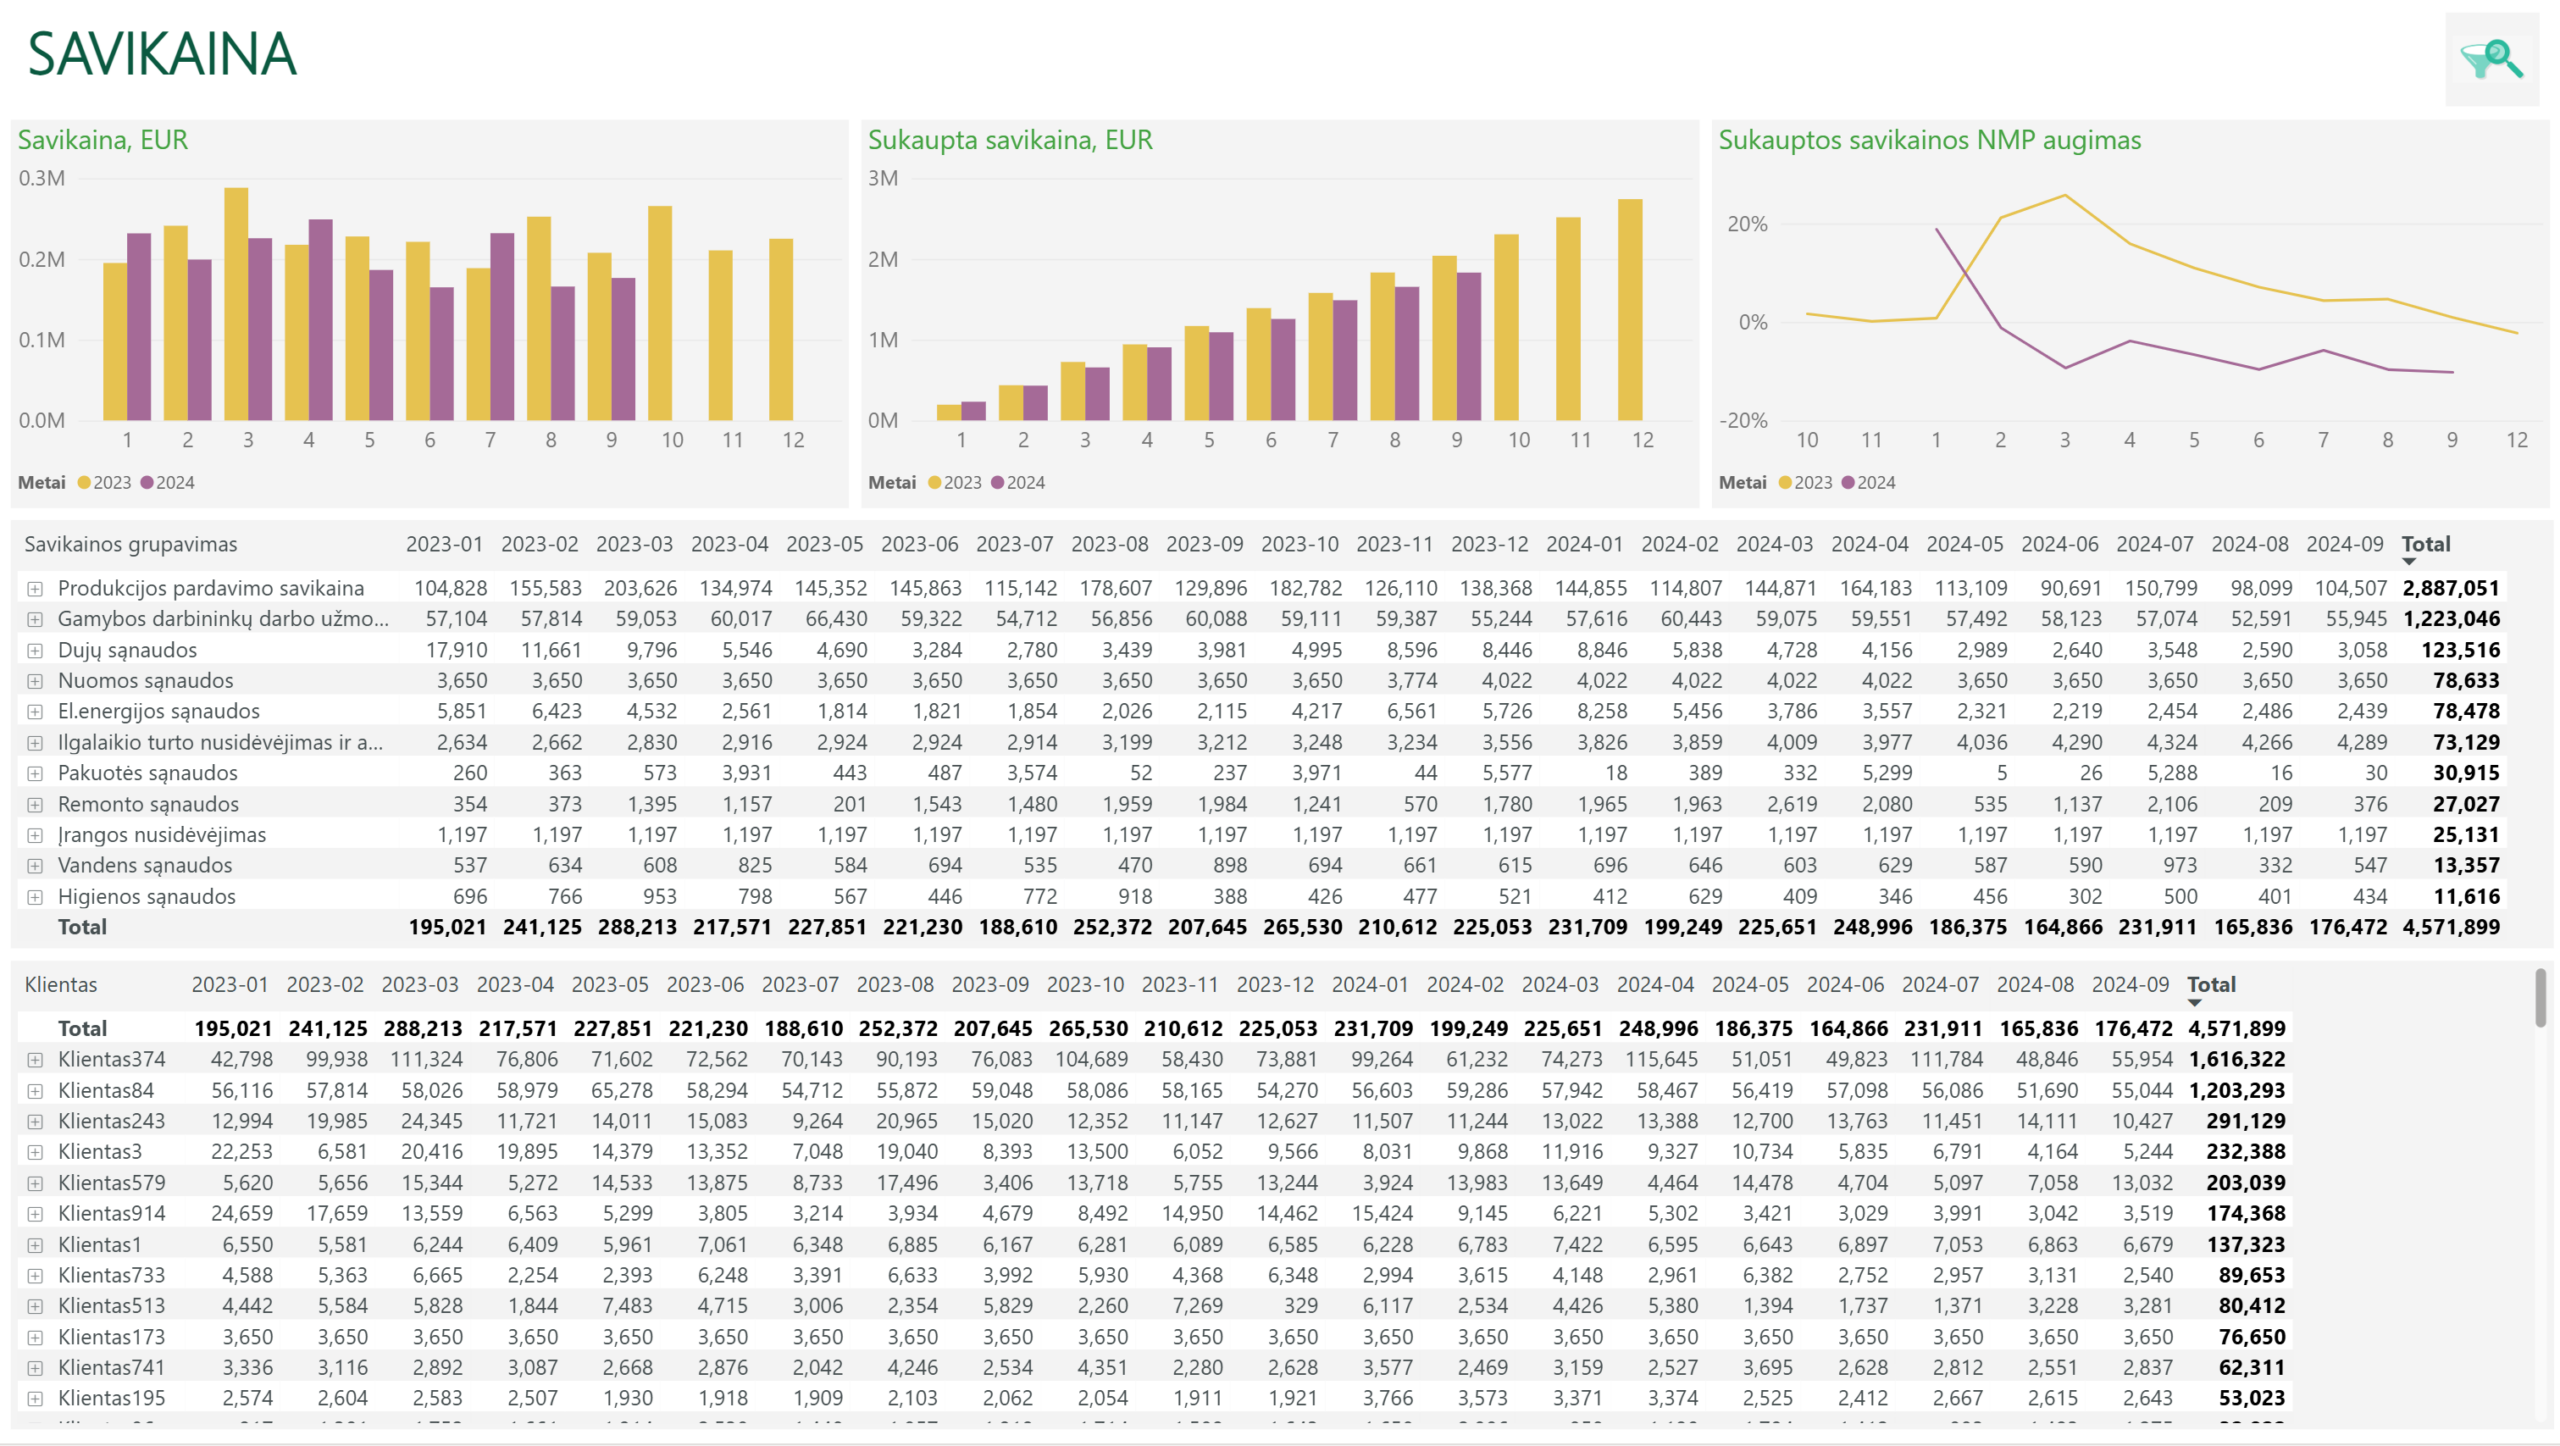
The cost of goods sold may increase due to higher sales volumes, changes in purchase prices, production costs, or other factors. When analyzing these changes, it is therefore important to identify which cost components have changed the most and what may have caused those changes.
The PLY Business Cost of Goods Sold report allows companies to examine their total cost of goods sold, its breakdown by cost category, and changes across different periods. When a significant change is identified, the analysis can be drilled down to individual general ledger accounts. This level of detail helps identify which cost categories have experienced the largest changes and determine where further investigation is needed.
Fluctuations in raw material prices can be particularly relevant for manufacturing companies. If the same raw materials are purchased from multiple suppliers, additional purchasing analysis can help compare supplier prices and track changes over time. For companies requiring more detailed raw material purchasing analysis, PLY Business can additionally implement a customized raw material analysis report.
Gross profit analysis across different business areas
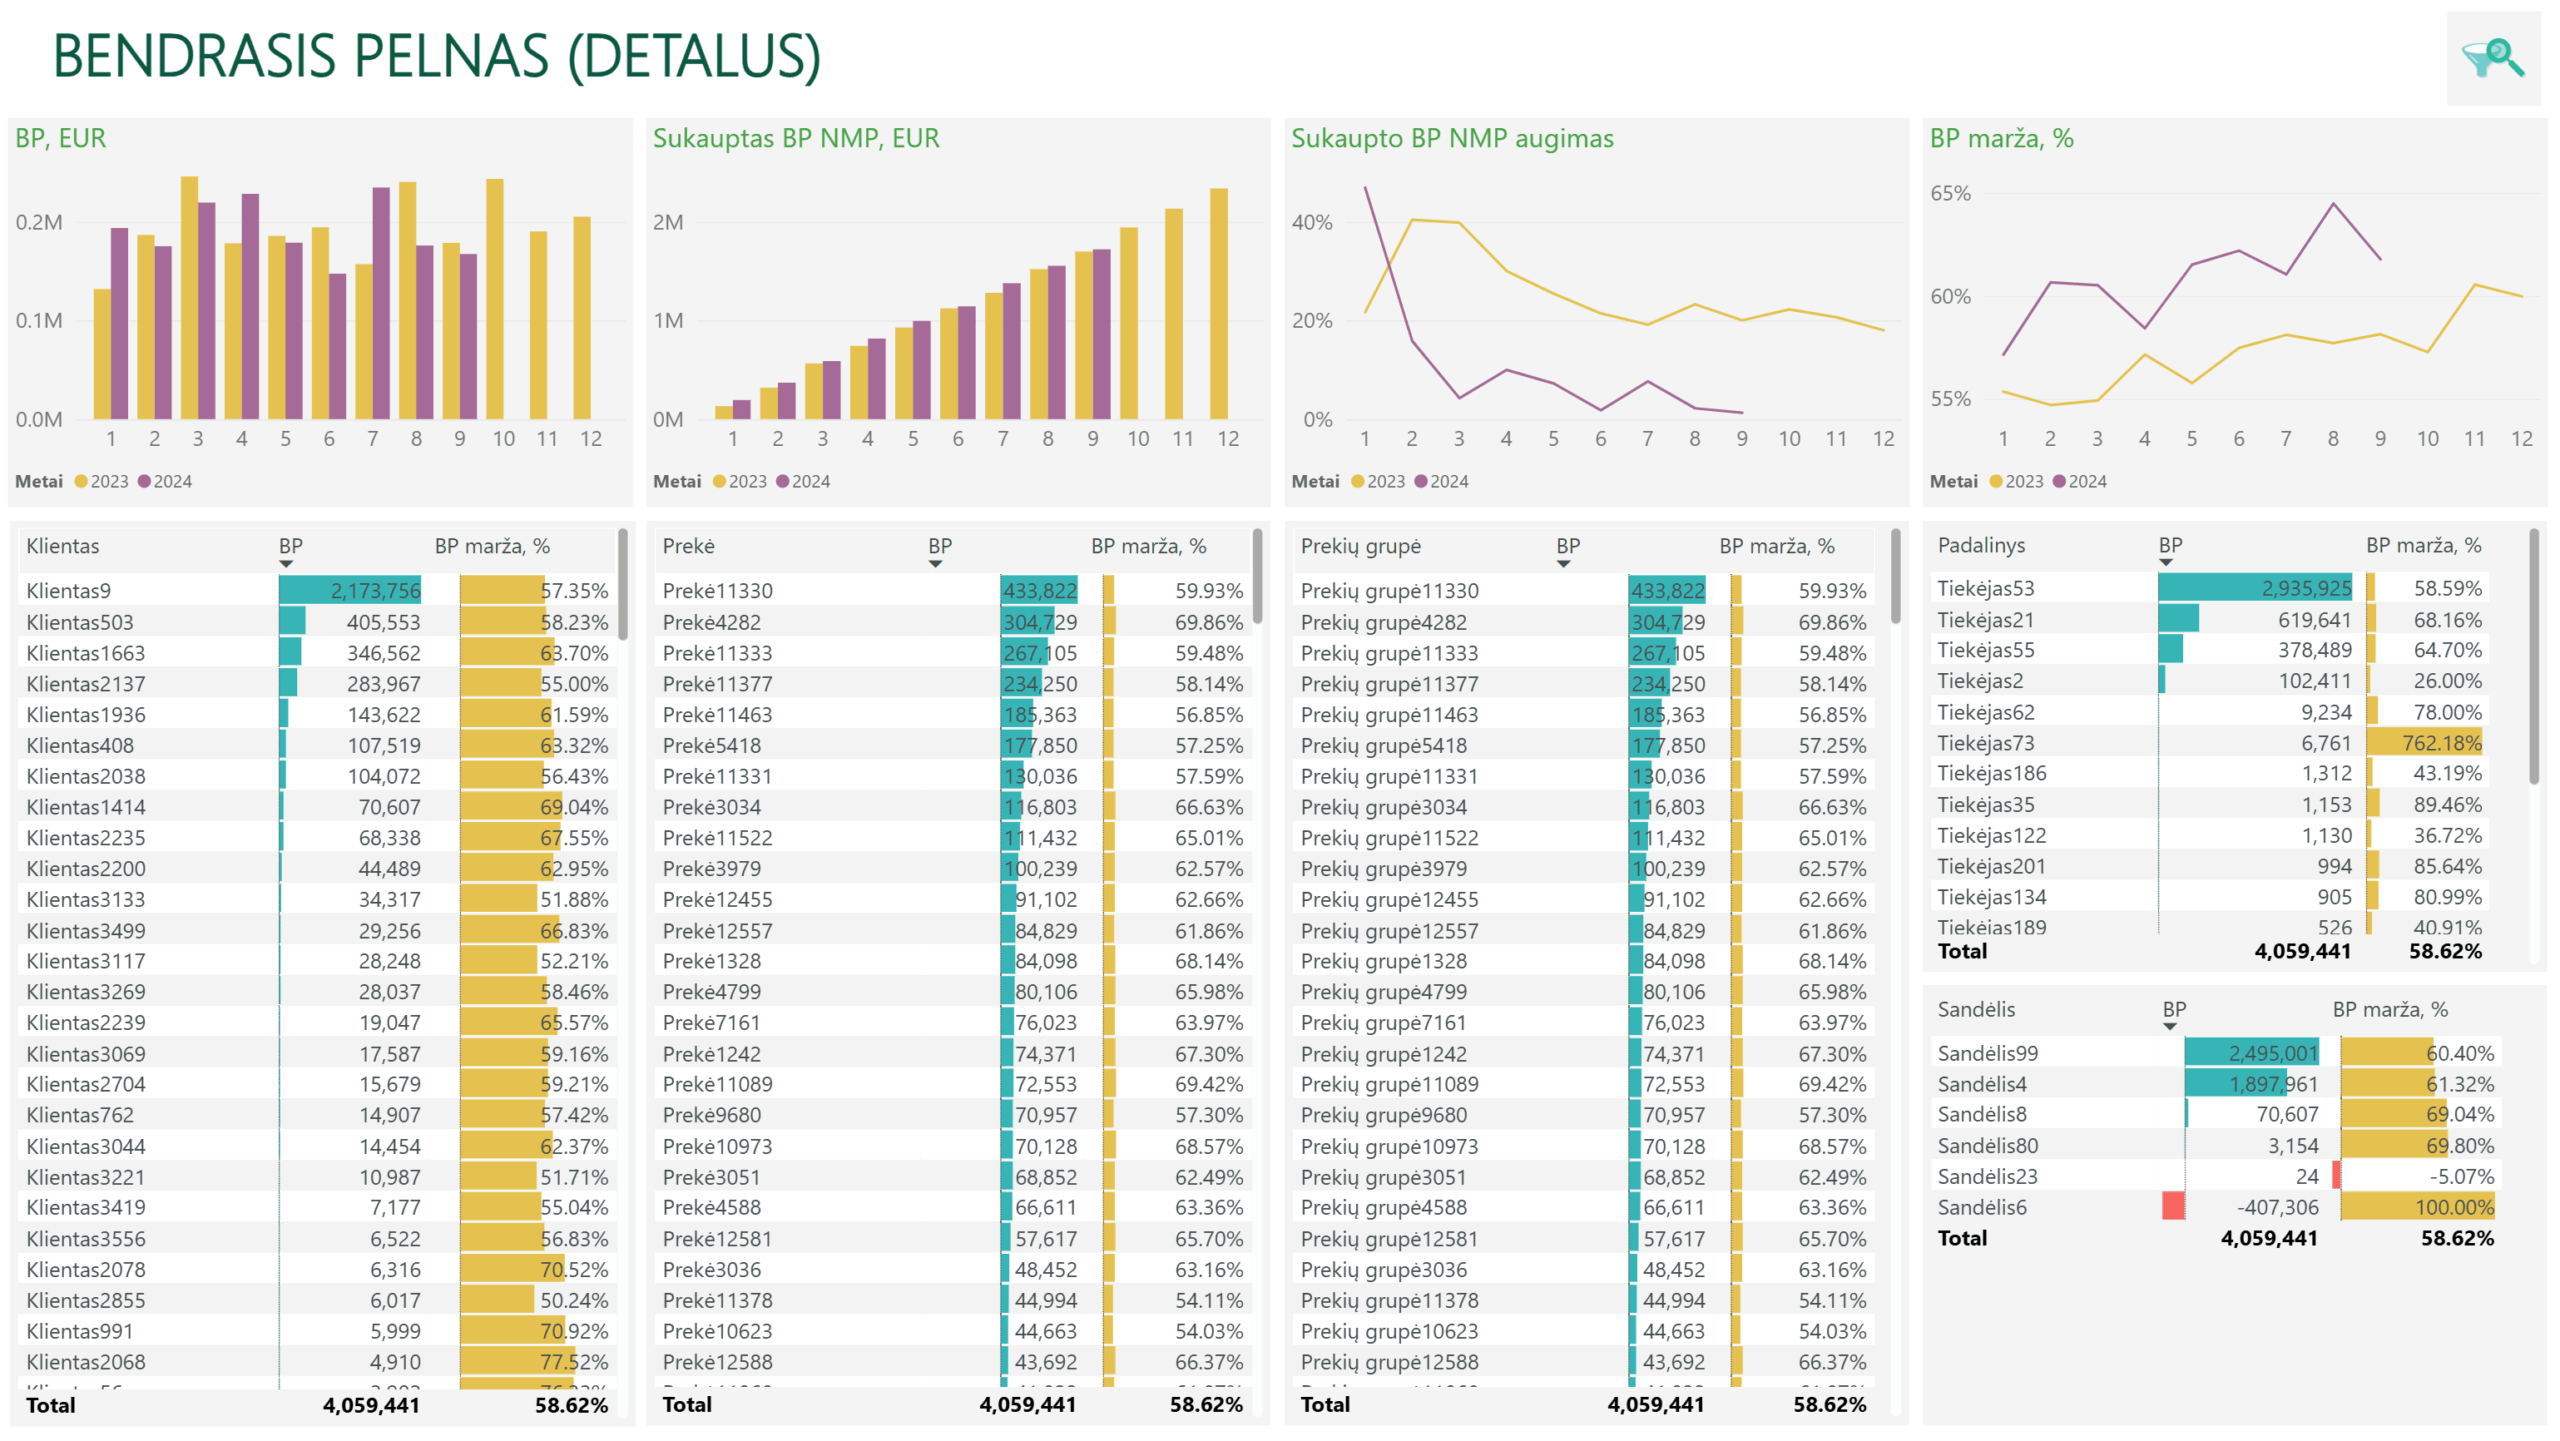
Gross profit analysis helps identify which products, services, or other business segments generate the highest gross profit, which achieve the highest margins, and which may be generating negative results.
The PLY Business demo Gross Profit report allows companies to compare gross profit and gross profit margins across different products and product groups, identifying which products generate the most gross profit and which are experiencing declining profitability. The analysis can also be broken down by customer, for example, to compare how the gross profit margin on the same product differs when sold to different customers. Such comparisons may reveal situations where a customer generating lower sales revenue receives larger discounts than one purchasing in greater volumes. This may prompt a review of whether previously granted discounts still reflect the customer’s current purchasing volumes and commercial terms. For companies requiring more detailed discount analysis and monitoring, PLY Business can additionally implement customized discount analysis reports.
A company’s overall gross profit margin may decline even when the margins of individual products remain stable. This can happen when the sales mix changes, with lower-margin products accounting for a larger share of sales revenue and higher-margin products accounting for a smaller share. Monitoring such changes is particularly important for companies whose products have significantly different gross profit margins.
Operating expenses and their impact on company profitability
Another possible scenario is that sales revenue and gross profit are increasing, while EBITDA is declining. In this case, one of the key areas for further analysis is changes in operating expenses.
As a business expands, its need for employees, premises, marketing, information systems, and other resources may increase. Therefore, when assessing operating expenses, it is important to understand which cost categories have changed the most, what caused these changes, and whether the increased expenses are justified. One way to assess this is to analyze operating expenses as a percentage of sales revenue. This ratio shows what proportion of revenue is accounted for by specific expenses and how that proportion changes over time.
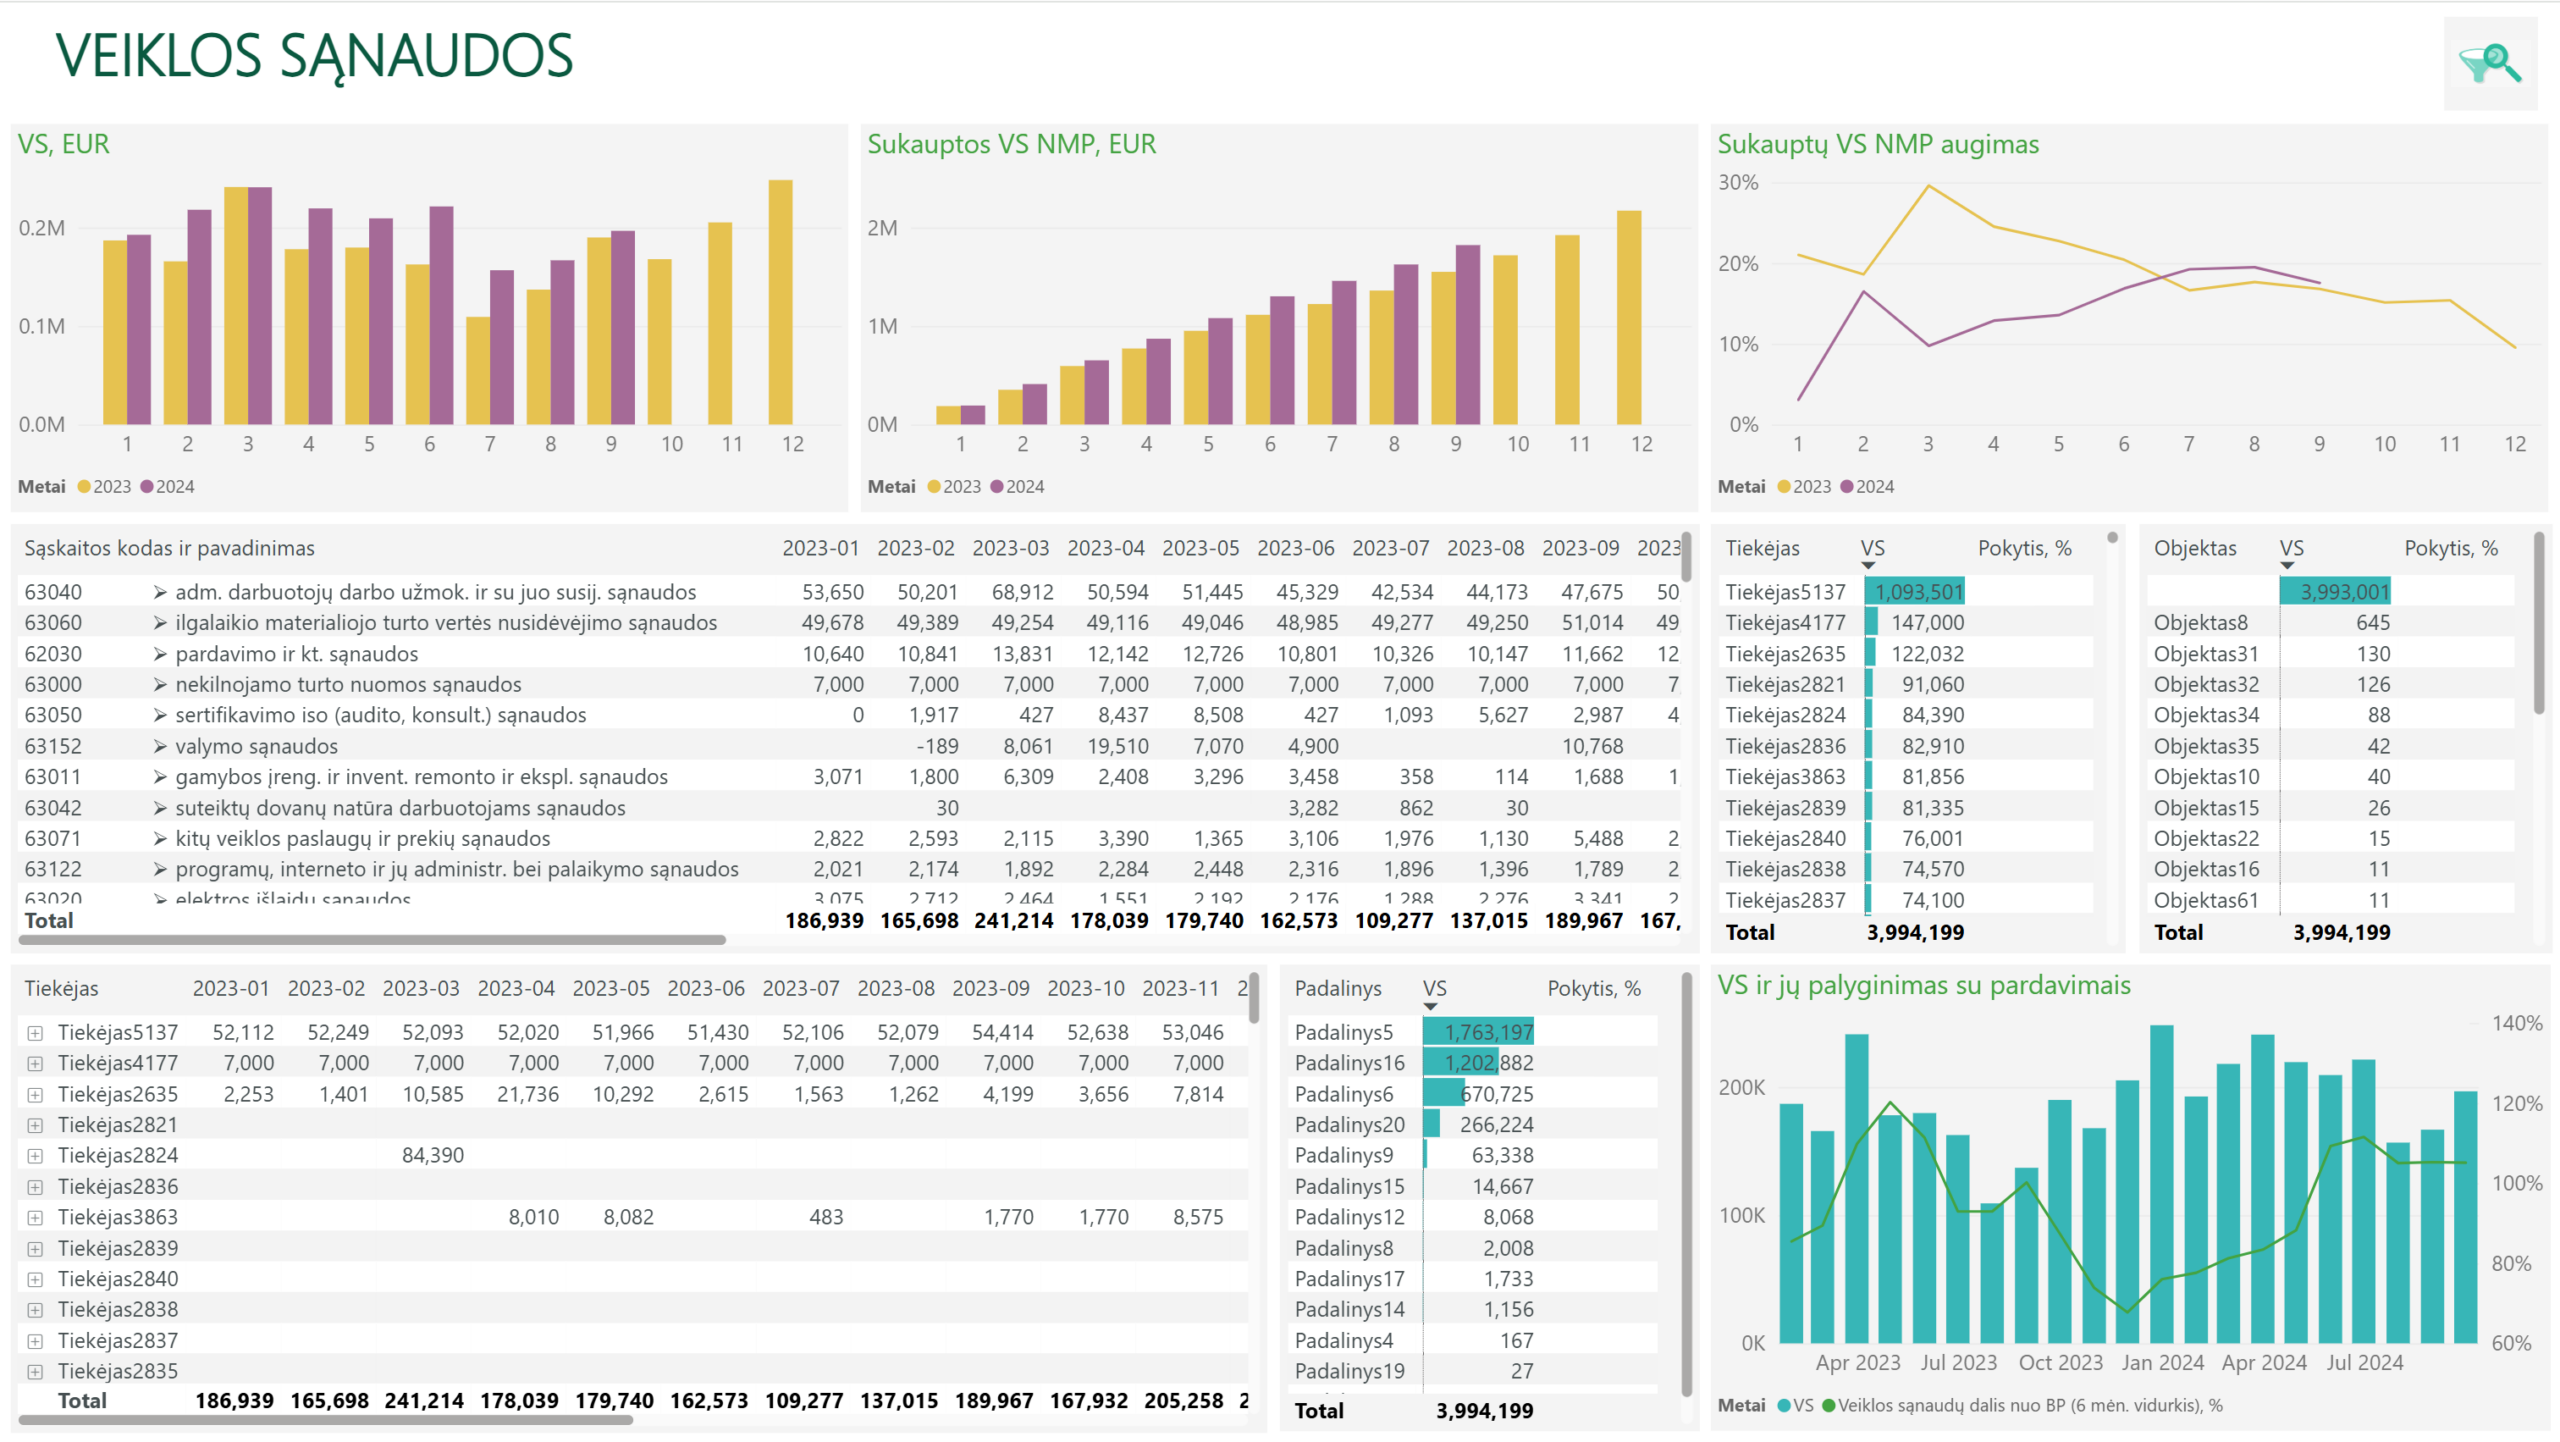
The PLY Business operating expenses report allows companies to monitor overall expense trends and operating expenses as a percentage of sales revenue. When a specific expense category or line item is selected, the report shows what percentage of revenue these expenses represent and how this ratio has changed across different periods.
When a significant change is identified, users can select the relevant period and examine it in greater detail. The report calculates year-over-year changes in selected expenses, broken down by suppliers, departments, objects, or other analytical dimensions used by the company. For example, it is possible to identify which departments and suppliers have experienced the largest increases in specific expenses. This helps highlight the most significant changes and determine where further investigation into their causes and justification may be needed.
This information is valuable not only for finance teams but also for managers responsible for individual business areas. It helps them assess whether expenses are justified, identify unusual changes, and decide where additional controls or a review of operational processes may be necessary.
When assessing a company’s profitability, it is also important to distinguish between EBITDA and operating profit. If EBITDA remains stable while operating profit declines, it is worth examining changes in depreciation and amortization expenses. If operating profit remains unchanged but net profit decreases, the reasons may lie in financial income and expenses, income tax expenses, or other items.
Is the company’s financial performance good?
After analyzing a company’s financial performance, it is useful to assess how its results compare within the broader market. For example, an increase in net profit margin over several years indicates improvement, but it does not necessarily mean that the company has achieved a high level of profitability relative to others in its industry.
Profitability is influenced by the business model, competition, pricing flexibility, cost structure, and other factors. Therefore, financial indicators are most meaningful when compared with those of similar companies, taking into account differences in their business activities, size, and other relevant characteristics.
In this area, PLY Business and PLY Insights complement each other. PLY Business enables companies to analyze their own financial performance in detail, while PLY Insights provides the opportunity to assess that performance in the context of other companies and the wider industry.
Read more about comparing financial indicators with other companies on PLY Insights: “Competitor analysis: what does the data reveal about your competitors and your market position?”.
What determines the quality and practical value of financial analysis?
The value of financial analysis becomes clear when a company can not only assess its overall profit but also understand what drives it, identify its most profitable business areas, and uncover opportunities to improve performance.
Simply presenting financial indicators in charts or tables is not enough. The data used in reports must be properly linked, financial metrics must be calculated according to the company’s financial logic, and the dimensions of analysis must reflect the specifics of its operations. High-quality financial analysis also requires accounting data to be recorded using a clear and well-designed structure that allows performance to be analyzed at the necessary level of detail. When developing customized analytics solutions, PLY Business specialists also advise companies on how to improve their accounting data structure and data recording practices so that financial reports provide a more comprehensive and accurate view of business performance.
PLY Business Power BI financial reports are then tailored to each company’s business model, chart of accounts, available data, and specific analytical needs. This makes it possible to connect overall financial results with detailed operational data and perform analyses that support informed business decisions.
Learn more about PLY Business financial analytics reports and their applications in the video “Company profitability analysis: what can detailed Power BI reports reveal?”.
If you are looking for customized Power BI reports that can help you better understand your company’s financial performance and identify opportunities to improve profitability, contact PLY Business.


